There are a confluence of debates and industry trends that can drive offseason discussion and analysis of this Milwaukee Brewers club.
- First, there is some debate as to whether the Brewers were “for real” in 2017, or whether they overplayed their “true” talent level on their roster. A corollary to this point is to argue “the Brewers exceeded expectations,” which is an easy argument to dismiss once it is pointed out that one can revise expectations, rather than expecting reality to converge with them (in other words, is it the Brewers’ 2017 performance that was “wrong”, or were low expectations of the club “wrong”? Of course, the truth probably rests somewhere in the middle, and analysts ought to work hard to avoid placing their own expectations ahead of the actual 2017 results).
- Second, there is industry discussion about whether baseball teams should be expected to “tank,” or “rebuild” in such a manner so as to be bad for an extended period of time, and only focus on the extremes as “rebuilding” or “contending.” The idea in the industry is that a baseball team should no longer “aim for the middle,” that being in the middle is now some kind of forbidden gray area, for a club will neither be expected to be a “true contender” or a “true rebuilder.” Obviously, the truths are quite gray in this debate as well, for a club can plummet to the bottom of the league for completely unexpected reasons, and previously “bad” clubs can skyrocket in just the same way.
- Finally, there is a question about whether front offices face the expectation to win from ownership groups, in the sense that there will be consequences if the club does not win. The trends toward “rebuilding” in this sense can be viewed as an additional layer of job security, as was pointed out in a fantastic industry reflection at FanGraphs; an ownership group cannot necessarily hold a front office accountable for their baseball decisions if any given roster and farm system is simply “part of a long term process.”
It is questionable as to whether teams are expected to simply “create the best team possible” in any given season. Here, one might even point to the slow 2017-2018 offseason to question whether ownership groups have placed enough pressure on GMs to mobilize available resources in order to improve their respective clubs (as each day passes in this slow market, it is an inefficient position for a GM with cash-at-hand to ignore signing a player that improves their club).
The #Brewers are currently on pace to be a true 90 win team, with a Run Differential that is +23 R on offense and +73 R on pitching/fielding
— BP Milwaukee (@BPMilwaukee) April 15, 2017
While it is difficult to address the latter points without detailed discussions with members of the industry, and a direct line to club executives and owners, it is possible to measure the first claim. In this regard, one such method is to track a club’s daily Pythagorean W-L, which is basically the club’s expected record based on the balance between their runs scored and runs allowed (versus the standards set by league and park). I tracked this manually via BPMilwaukee Twitter throughout the summer, as the exercise gained a surprising amount of interest from Brewers fans (and it was a lot of fun). Following up the exercise by using Baseball Reference CSV to reconstruct the 2017 season, one can validate the general lesson learned from BPMilwaukee Twitter: the Brewers were exactly the club their final record alluded to very early in the season, and in fact they were an extremely steady club.
The #Brewers are on pace to play true 85 win baseball (+33 RS / +19 RA). 85 wins is their 2017 Daily Pythagorean W-L mean record.
— BP Milwaukee (@BPMilwaukee) June 16, 2017
Here’s a visual demonstration of the 2017 Brewers’ steadiness, which Indexes their daily performance to the club’s average park-adjusted RS / RA record for 162 games.
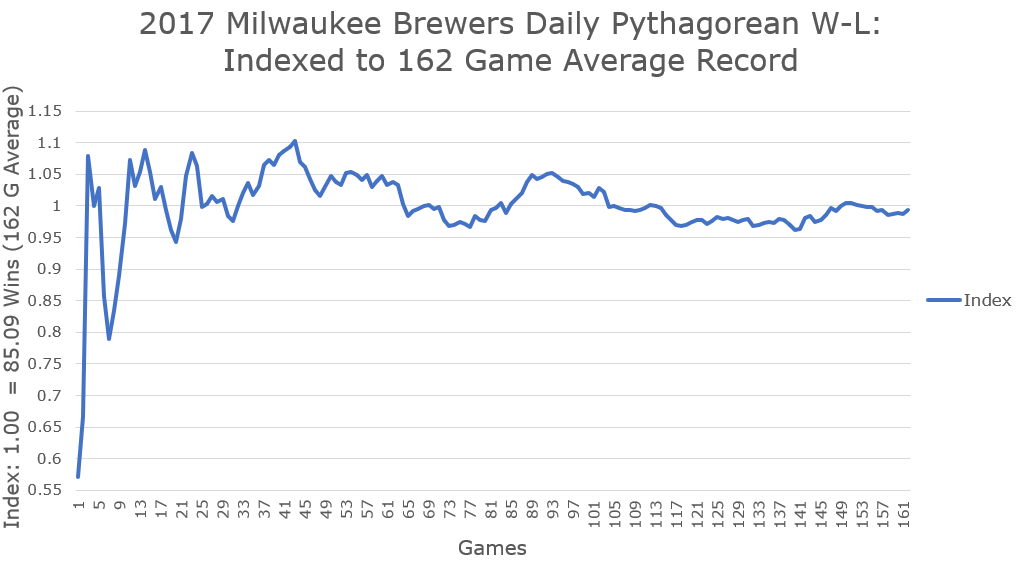
By game 11, the Brewers were on the way to their first extended period of play above their average 2017 talent level (as demonstrated by 162 games of RS / RA performance). By game 27, the club was clearly established as an average 85 win club (or so), and this trend clearly settles by the middle of the season. Those “expectations” that the club would win fewer than 80 games? The last point at which that was a concern was game number nine. These 2017 Brewers were indeed quite consistent, and they played according to their true talent level throughout the season: they were an 85 win club based on their park-adjusted RS / RA.
The 2017 Brewers were an 85 win club. Establishing this reality runs straight into one of the industry dilemmas described above: these Beloved Milwaukee Nine were smack dab in the middle of the league, that middle road that is strongly advised against by the tank advisors. If you’re not going to be a clear contender, you’d better be rebuilding, and the Brewers were doing neither in 2017 by most estimations; almost no one was ready to call them a “true” contender, and any thoughts about the club rebuilding were dashed by a lack of trades away from MLB contracts in favor of prospects. In fact, even if they were depth prospects like Ryan Cordell, prospects were starting to head out the door in midseason trades, and the front office was even heavily rumored to be involved with top trade targets. The Brewers were metaphorically in the middle of the league in terms of narrative, and an audacious roster of unassuming players proved that the middle ground was worth it every day of the season; manager Craig Counsell’s club was playing right on target.
In contrast to the industry trend, and sometimes clamoring fans, in favor of the rebuild, these Brewers raise an interesting question about residing in the middle of the road. In fact, searching for a legacy of the tenure of GM David Stearns thus far, this very question about the fruits of residing in the middle of the league may be the most radical accomplishment of the front office: what is a playoff team? What is the identity of a playoff team? How many wins does a contender have in the middle of the season?
While constructing Daily Pythagorean models for the Brewers, throughout the fall of 2017 I used Baseball Reference CSV to reconstruct the daily performances of each playoff team during the New Wild Card era (2012-present), as well as any clubs that were relatively close to .500 or the Wild Card spot in the middle of each respective season (this allowed me to include teams like the 2017 Brewers in studies of contending clubs during this recent playoff era). This sample yielded 60 playoff teams and 31 non-playoff teams from 2012-2017. My purpose in constructing this study was to look at each playoff team’s average W-L over 162 games, average Pythagorean W-L over 162 games, their midseason and end of season actual Pythagorean W-L, and the standard deviation of each measure.
- Mid_RS/RA measures the club’s average Daily Pythagorean W-L at 81 games. (Mid_StDev is the standard deviation of that statistic).
- Avg_W-L measures the club’s 162 game average of their actual daily W-L pace.
- W-L is the club’s actual 162 game win total.
- End_RS/RA is the club’s actual Pythagorean W-L after 162 games.
- RS/RA-Avg measures the club’s 162 game average of their daily Pythagorean W-L. (End_StDev is the standard deviation of that statistic).
- WinDiff is the difference between each club’s average daily W-L and their average daily Pythagorean W-L. (E.g., how much did each team overplay or underplay their run differential on a daily basis?).
The following table is a summary of the playoff teams and contenders that missed the playoffs in the new Wild Card Era:
| Year | Mid_RS/RA | Mid_StDev | Avg_W-L | W-L | End_RS/RA | RS/RA-Avg | End_StDev | WinDiff |
|---|---|---|---|---|---|---|---|---|
| 2012 | 86.5 | 9.4 | 88.9 | 88.4 | 86.1 | 86.3 | 8.1 | 2.6 |
| 2013 | 91.3 | 11.7 | 91.1 | 90.3 | 89.0 | 90.5 | 9.1 | 0.6 |
| 2014 | 86.9 | 10.7 | 89.3 | 88.7 | 87.0 | 87.0 | 8.1 | 2.3 |
| 2015 | 86.3 | 11.4 | 88.0 | 88.9 | 87.8 | 87.0 | 8.8 | 1.0 |
| 2016 | 92.5 | 11.1 | 90.4 | 89.3 | 88.5 | 91.0 | 9.1 | -0.6 |
| 2017 | 90.3 | 10.9 | 90.9 | 91.0 | 92.1 | 90.8 | 8.4 | 0.1 |
The logic of focusing on these statistics was to (a) capture the extent to which playoff teams outperform or underperform their RS / RA over the entire course of a season, and (b) to capture whether playoff teams posted average W-L that were better or worse than their actual overall records. Each of these metrics were used to construct a well-rounded view of the volatility of a baseball season over 162 games; in the aggregate, they also show how different each season is in terms of playoffs composition (for example, the average W-L pace of playoff clubs and contenders in 2012, 2014, and 2015 were not as good as those in 2013, 2016, and 2017; even still, the average contenders and playoff clubs in 2016-2017 were not as good as those in 2013).
An auxiliary goal of this research was to place the Brewers within a larger constellation of recent playoff teams and contenders that fell short, in order to determine whether this club was an outlier: how frequently is a club like the Brewers a playoff team during the new Wild Card years?
Focusing on the playoffs teams alone, at first glance there seems to be little benefit to residing in the middle of the league: 45 percent of playoffs teams from 2012-2017 posted final wins totals at 94 or above. One quarter of the teams posted records of 89 wins or fewer.
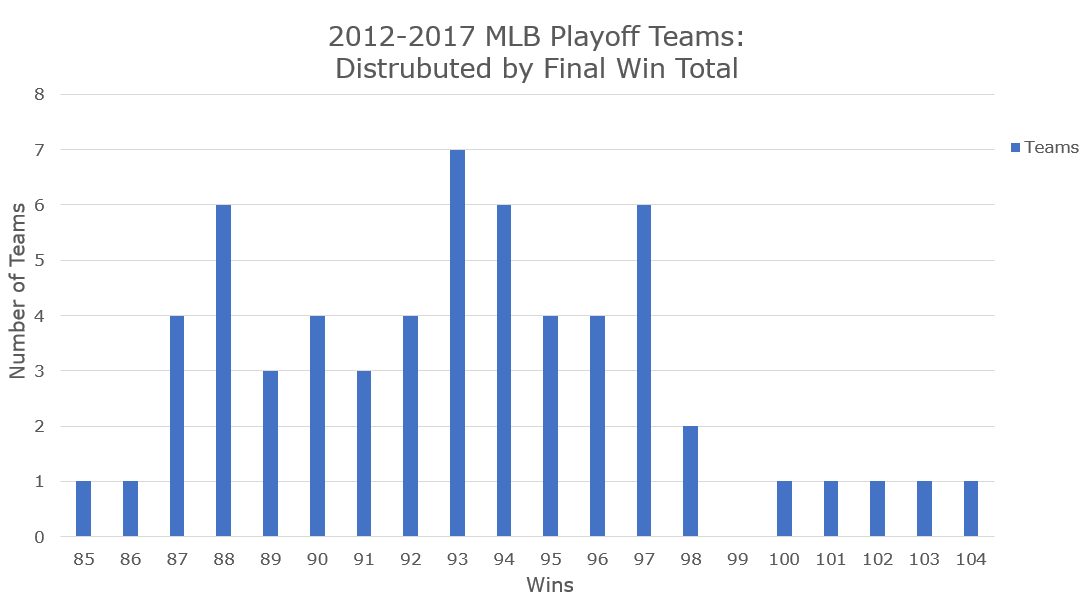
(For fun, an aggregated distribution of 2012-2017 MLB playoff team win totals nearly approximates a normal curve):
| 2012-2017 | Playoff Teams | % of Teams |
|---|---|---|
| 85 to 86 | 2 | 3.3% |
| 87 to 88 | 10 | 16.7% |
| 89 to 93 | 21 | 35.0% |
| 94 to 97 | 20 | 33.3% |
| 98 to 103 | 6 | 10.0% |
| 104 | 1 | 1.7% |
Yet, when shifting to midseason runs scored / runs allowed, the range of Pythagorean W-L records is much larger, and skewed toward lower wins totals. Using midseason Pythagorean W-L, only 46 percent of playoffs teams from 2012-2017 posted expected wins totals above 89 wins; here, one quarter of the teams posted expected records of 84 wins or fewer.
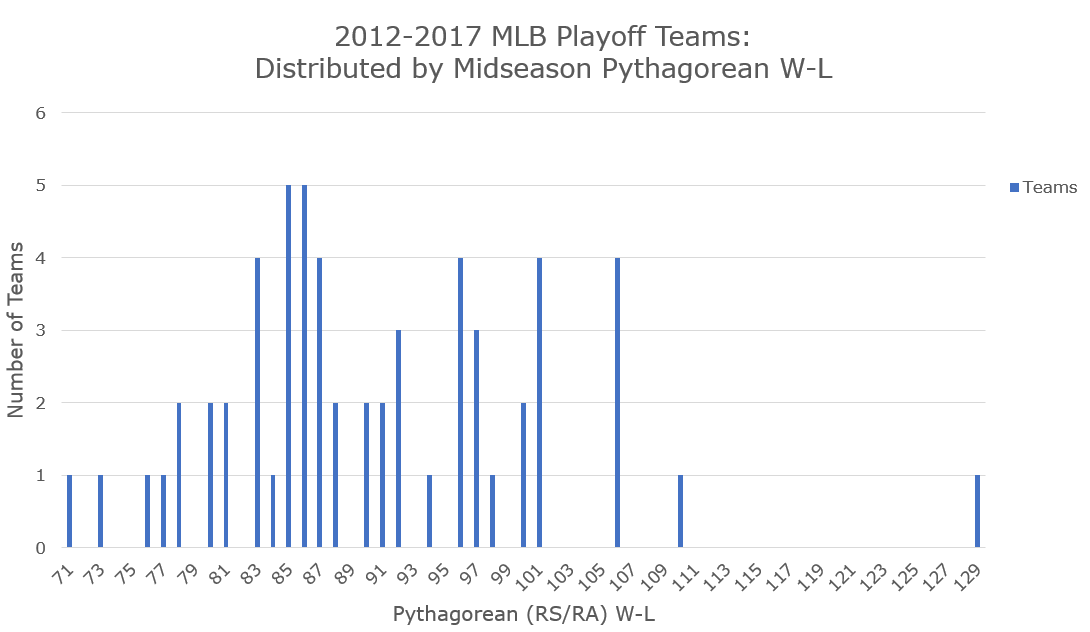
[Visually, these two charts are quite an appealing demonstration of “regression to the mean,” I’d argue: a projected W-L range that spans 60 wins at midseason shrinks to a 20 win range. Playoffs teams establish themselves by “surging” from a slow start, or “declining” from a great start. Baseball equalizes almost everyone!]
Simply contrasting these two line charts, one can readily see that although playoffs teams boast a relatively compact set of relatively high wins totals, these clubs look entirely different only 81 games into each season. Searching for meaning in these statistics, one might raise questions about what a “true” contender looks like in terms of outlining trade deadline strategies. Additionally, one could seek “micro-narratives” within each season, recognizing that a playoff team may not “look” like a true contender in game 25, game 40, game 81, or even game 120 (that’s the last point at which the 2017 Cubs were underplaying their average Pythagorean W-L). As the Cubs demonstrated last season, all it takes is a 42 game sprint to win a division (and they are hardly the only example of this phenomenon; for example, the 2012 Baltimore Orioles looked like a sub-.500 team between games 74 and 150 if one was solely using RS / RA).
Comparing these distributions with the full playoff and contending team summary table above, one can find that typical fan “targets” for contending goals hold true: in the New Wild Card Era, aiming for roughly 89 to 90 wins on average will get a team into the playoffs or thoroughly within the hunt. Yet, it is worth emphasizing that in half of the seasons, a midseason average Pythagorean W-L pace of 86 wins defined playoffs contention. While a club may need to reach 89 to 90 wins in order to become a highly probable playoff club, they need not be a 90-win team from the get go.
I focused specifically on average midseason Pythagorean W-L in order to make a point about the development of an MLB season, and the potential importance of sitting in the middle of the pack. If a ballclub is hovering around .500 in terms of their RS / RA, 81 games provides plenty of time to turn the season around through trades, hot streaks, mechanical adjustments, development advancements, minor league promotions, and other transactions.
Interestingly enough, nine of these 91 teams surveyed boasted midseason Pythagorean W-L above 89 wins and failed to reach the playoffs, which should raise the question about what a “true” playoff team looks like (which gets back to the original point about challenging “expectations,” as well). Not surprisingly, nine of these 91 surveyed teams boasted midseason Pythagorean W-L at or below 81 wins and made the playoffs, which should seem stunning in light of the previous statistic: two teams that are on pace to be 10 wins apart at midseason may swap positions by the time that the playoffs come around (see the 2013 Dodgers versus 2013 Rockies and Diamondbacks, for example, or the 2012 Giants and the 2012 Dodgers).
Those 2012 Orioles were a true playoff club despite their lowly midseason RS / RA, for instance, but in 2013 the Baltimore Nine had a midseason Pythagorean W-L of 90 games and sputtered to 85 wins. Brewers fans know this pain all to well, as in complete contradiction to the True Blue 2017 squad, the 2014 Brewers were expected to win 91 games in the middle of the season, only to painfully collapse and close the window on one particular era in the ugliest fashion possible. Incidentally, I wish I kept Daily Pythagorean W-L in 2014, because if I had, we all could have expected the downturn much earlier: according to Daily Pythagorean W-L, our Milwaukee Nine were expected to be an 83-to-85 win club between July 10 and August 7, foreshadowing the club’s 82 actual win total.
So the Brewers are in the middle of the league. Judging by the club’s current roster construction, should no further moves be made, the 2018 Brewers should look a lot like the 2017 version that stormed the league: unassuming starting pitching rotation that could produce serviceable-to-above-average results; power / speed / aggression at the plate and on the bases; absurd position player depth in order to withstand injuries, ineffectiveness, and provide flexible match-ups; serviceable fielding with an emphasis on great groundball fielding up the middle (may Jhoulys Chacin feed Orlando Arcia and Jonathan Villar or Eric Sogard); and, an elite bullpen (in fact, this version looks even better and is battle-tested entering 2018). Yet, it is not clear that projection systems are going to fawn over these Brewers, for many areas of the club will not look intimidating in terms of statistics or scouting profiles.
| Setting 2018 NL Expectations | NL East | NL Central | NL West |
|---|---|---|---|
| Clearly Contending | Nationals | Cubs | Dodgers |
| 2017 Surprises | Brewers | Rockies / Diamondbacks | |
| Ending Rebuild? | Phillies / Braves | ||
| Clearly Rebuilding | Pirates / Reds | Padres | |
| Rebound from 2017 | Mets | Cardinals | Giants |
| Project Wolverine | Marlins |
But, with the bottom falling out of the National League thanks to a convergence of ongoing and newly minted rebuilding / firesale efforts coupled with a graduation of rebuilding efforts or injury-riddled / underwhelming / stuck 2017 clubs, the middle could once again prove to be a feasting area within the National League. Hardly 20 percent of the league can be defined as clearly contending, meaning that there is ample ground to be seized from the remainder of the league.
GM David Stearns and President Doug Melvin spearheaded a brief rebuilding effort, and for all the hype about the new GM’s “analytic” bent, the 2017 and 2018 clubs are looking a lot like Melvin’s old strategy that often caught hell with fans: the club is simply in the middle. We return to the familiar ground of simply sticking in the middle of the pack and seeing what happens. Perhaps this time around, the rebuild will shine a bit brighter in terms of player development or big time trade returns; maybe the Brewers will end all this talk by signing Jake Arrieta. Regardless, Stearns deserves credit for bucking industry roster building signposts (either “obviously rebuild” or “clearly contend”), and if the Pythagorean trends of the New Wild Card Era hold, our Milwaukee Nine could quite easily be in the thick of things with a 78-to-85 win midseason RS / RA pace.
Photo Credit: Jeff Curry, USAToday Sports Images
Curious: What team had the 129 win Pythagorean?
Good question! That would be the 2016 Cubs when they looked like a historic club.