The 2015 Milwaukee Brewers didn’t do many things well, but they did manage to put together a strong bullpen. Remember those days? When the team could count on Francisco Rodriguez, Will Smith, Michael Blazek, and Jeremy Jeffress to preserve late-game leads? That halcyon campaign — in which Brewers relievers ranked seventh in adjusted ERA and seventh in DRA — would, we hoped, not be a fluke.
Like the capricious creatures they are, though, Milwaukee’s bullpen has betrayed it this season. The club currently places 17th in relief ERA- and plummets to 23rd in relief DRA. K-Rod went to Detroit in the first of several high-profile offseason trades, Smith got hurt in spring training and has struggled to regain his footing, and Blazek has pitched as poorly in the minors as he has in the majors. All in all, it’s gotten pretty ugly for the Brew Crew.
While Jeffress’s 2.23 ERA doesn’t reflect it, he’s encountered some 2016 problems too. In June, my colleague Julien Assouline noted that Jeffress’s strikeout rate has dropped off a cliff this year — he’s fanned 17.3 percent of the batters he’s faced, compared to 23.5 percent last season — which has spiked his DRA to 4.26. Jonathan Judge, one of the minds behind that metric, told Julien via email that the K rate was “fairly abysmal for a high-leverage reliever.”
Something seems odd about this, however. From 2015 to 2016, Jeffress has dramatically increased his clips of strikes (63.1 to 69.7 percent) and called strikes* (25.5 to 29.4 percent), while suffering only modest declines in foul strikes* (25.6 to 22.9 percent) and swinging strikes* (19.8 to 16.3 percent). This matters because, in 2014, RotoGraphs’ Mike Podhorzer created an expected strikeout rate equation that incorporates those four variables. Among the 229 pitchers with 40+ innings this season, Jeffress’s residual stands apart:
| Str | Name | IP | Str% | L/Str | S/Str | F/Str | xK% | K% | Diff |
|---|---|---|---|---|---|---|---|---|---|
| 1 | Logan Verrett | 62.0 | 65.7% | 26.2% | 13.2% | 31.5% | 18.8% | 14.8% | -4.0% |
| 2 | Jeremy Jeffress | 40.1 | 69.7% | 29.4% | 16.3% | 22.9% | 20.6% | 17.2% | -3.4% |
| 3 | Jered Weaver | 107.2 | 66.1% | 30.3% | 13.5% | 22.6% | 16.2% | 12.9% | -3.3% |
| 4 | Fernando Salas | 42.1 | 65.9% | 21.6% | 16.9% | 33.3% | 20.4% | 17.2% | -3.2% |
| 5 | Matt Cain | 59.2 | 65.0% | 29.8% | 13.8% | 25.9% | 18.7% | 15.6% | -3.1% |
| 6 | Jeurys Familia | 44.1 | 65.6% | 21.0% | 26.2% | 26.0% | 26.9% | 24.0% | -2.8% |
| 7 | Clay Buchholz | 80.2 | 61.8% | 27.5% | 15.8% | 25.7% | 17.8% | 15.0% | -2.8% |
| 8 | Dylan Bundy | 41.1 | 65.5% | 21.9% | 18.1% | 33.0% | 22.2% | 19.4% | -2.8% |
| 9 | Mike Foltynewicz | 56.0 | 67.7% | 29.0% | 16.4% | 28.4% | 24.6% | 21.7% | -2.8% |
| 10 | Felipe Rivero | 45.2 | 65.8% | 27.0% | 24.4% | 24.0% | 29.5% | 27.0% | -2.5% |
*These are as percentages of all strikes.
The question, then, revolves around the l-word: luck. Has Jeffress earned his low strikeout rate, or has he simply been unfortunate? The expected strikeout equation would appear to suggest the latter, but by late July, chalking something up to luck and walking away just feels so lazy. Let’s dive a little deeper.
Baseball Savant can give us a handy breakdown of Jeffress’s production by count. We’ll narrow in on the putaway pitches — looking and swinging strikes. Perhaps Jeffress has fared worse once he’s gotten to two strikes?
| Count | 2015 Look% | 2016 Look% | 2015 Whiff% | 2016 Whiff% |
|---|---|---|---|---|
| 0 Strikes | 26.0% | 33.7% | 7.1% | 6.7% |
| 1 Strike | 9.2% | 11.9% | 13.4% | 14.6% |
| 2 Strikes | 5.1% | 5.4% | 20.9% | 15.0% |
Yeah, that’s definitely the case. In zero- and one-strike counts, Jeffress has looked like a much better pitcher than last year, racking up even more called strikes without sacrificing whiffs. After that, though, it’s fallen apart. Jeffress’s two-strike called strike rate has stagnated, and his swinging-strike rate in those situations has shrunk. He’s still accrued two strikes about as often — 49.8 percent of his adversaries had such a count in 2015, which has dipped a bit to 48.0 percent in 2016 — but from there, he’s completely lost it.
Heading over to Brooks Baseball gives us a clue as to what might have caused this. Check out Jeffress’s count-based pitch usage splits:
| Count | FF% 2015 | FF% 2016 | SI% 2015 | SI% 2016 | CH% 2015 | CH% 2016 | CU% 2015 | CU% 2016 |
|---|---|---|---|---|---|---|---|---|
| 0 Strikes | 23.1% | 7.8% | 58.1% | 76.4% | 0.4% | 0.8% | 18.4% | 15.1% |
| 1 Strike | 21.0% | 14.1% | 61.6% | 63.2% | 2.7% | 4.9% | 14.7% | 17.8% |
| 2 Strikes | 28.5% | 14.3% | 35.2% | 33.3% | 2.4% | 10.9% | 34.0% | 41.5% |
Earlier in the at-bat, Jeffress has basically replaced his four-seamer with his sinker, while leaving his slower pitches untouched. With two strikes, he’s moved away from both of his hard offerings, in favor of a breaking/offspeed diet. The former change has netted him the increase in called strikes, and the latter has cost him his swinging strikes, right?
The first theory holds true — Jeffress’s sinker has a looking-strike rate of 22.0 percent this season, far superior to his four-seamer’s 16.4 percent clip. The second idea, on the other hand, doesn’t suffice. In 2016, Jeffress’s changeup and curveball have the two highest whiff rates of any pitch in his arsenal, at 14.8 and 14.3 percent, respectively. The curve also has the best called strike rate of the bunch at 28.6 percent, although the cambio’s 3.7 percent figure doesn’t help much. Overall, it seems like his slower options should function better as out pitches. So why haven’t they?
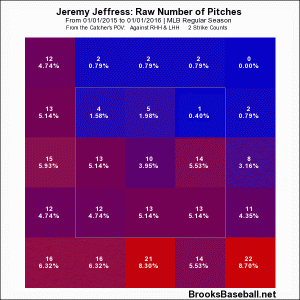
The answer to this riddle may lie in Jeffress’s pitch location. He’s buried pretty much every pitch with two strikes:
That dramatic move looks like it’s cost Jeffress his Ks: Hitters haven’t whiffed too often at his low pitches, both as a whole and with two strikes. They have put those pitches on the ground, as you’d expect, which leads to the possible underlying cause of this whole mess: a pitch-to-contact approach. Compared to last year, hitters have had a much harder time squaring Jeffress up — their hard contact rate has decreased from 27.5 to 20.9 percent, according to FanGraphs. Perhaps Jeffress is fine with giving up strikeouts if it means a weaker grounder.
Returning to the original question: Does Jeffress’s lower strikeout rate reflect bad luck, or intention? To paraphrase everything Ron Fournier has ever written, the answer lies somewhere in the middle. Jeffress’s curveball and changeup seem pretty deadly, so you’d expect his strategy to result in more swings-and-misses in the future. If he doesn’t put them in the right location, though, that might not materialize.
Whatever the case may be, the Brewers will need Jeffress at his best. Rodriguez is literally gone; Blazek is figuratively gone, and Smith may be as well. As Julien noted in his post, Tyler Thornburg has dominated in 2016, but one ace reliever does not a bullpen make. With or without strikeouts, let’s just hope that Jeffress can keep closing out games in Milwaukee.
All data as of Thursday, July 21st.

