One of the best aspects of following the Milwaukee Brewers’ recent playoff run was seeing numerous figures from Brewers teams past participate in pregame ceremonies. Our beloved franchise is known as a losing franchise, and for good reason: you can count Brewers playoff appearances on one hand (1981, 1982, 2008, 2011, 2018). Ryan Braun is the only player in franchise history to appear in two separate generations of playoff rosters. So on and so forth…Yet watching these fan favorites throw out first pitches was a delight, because these are our franchise memories, even if they did not always succeed, appealing to the moment that sports fandom ceases to be about the game on the field and becomes an opportunity to cheer for a personality, find an underdog, or simply recognize excellence.
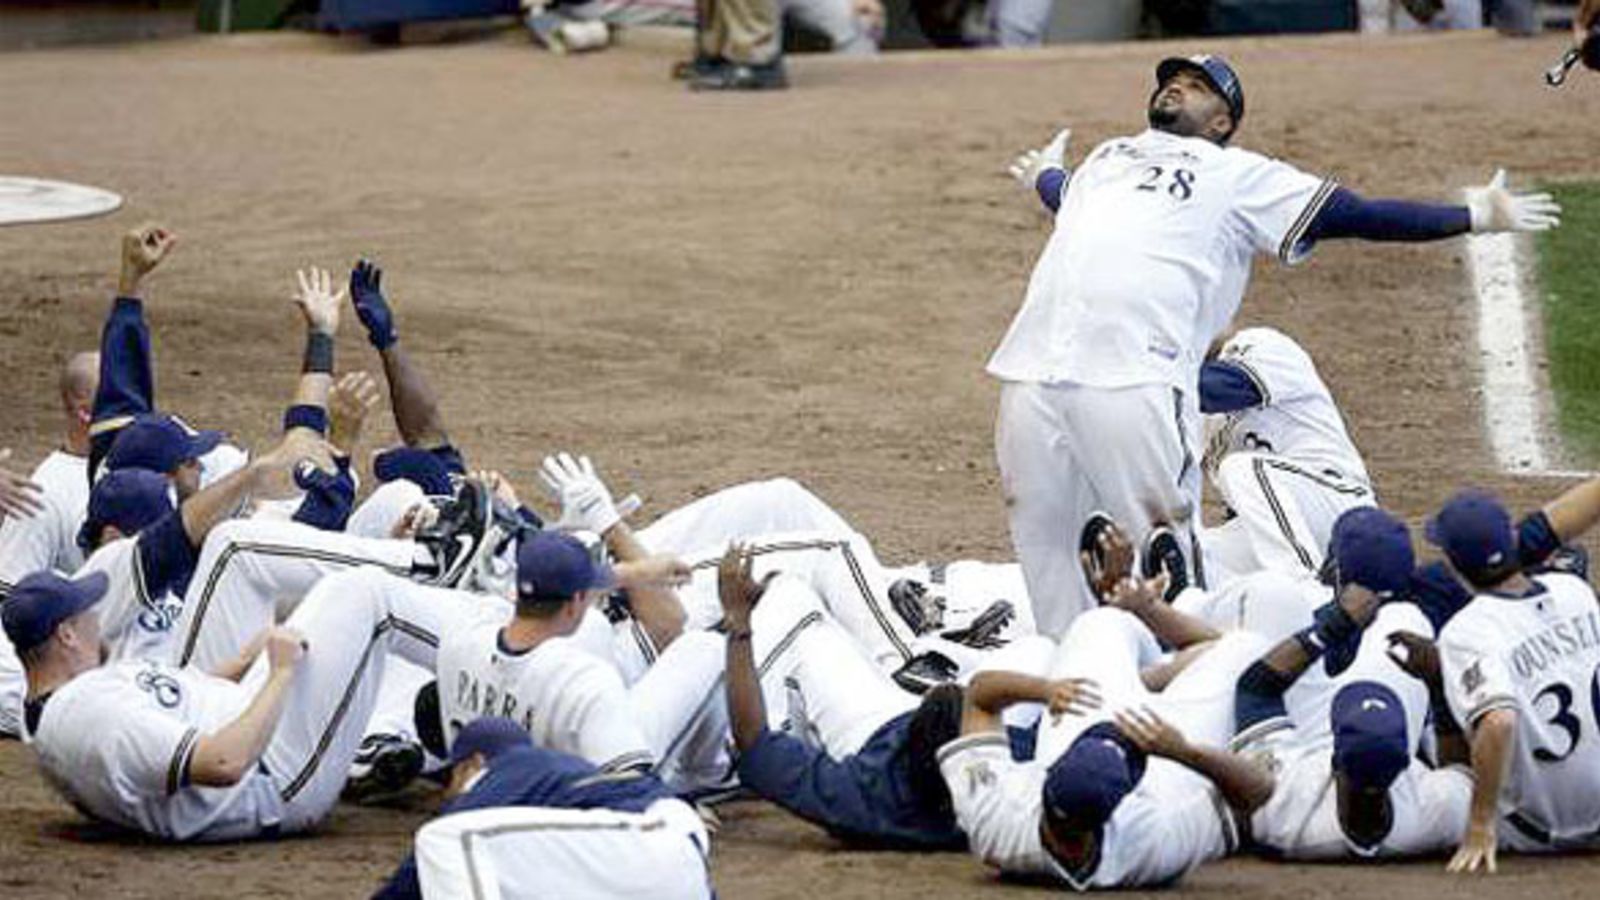
In that last category stood Prince Fielder, who elicited tears of joy from a Brewers fanbase ready to watch Fielder and former teammate Ryan Braun get back to basics with that 1-2-punch celebration. Little did we know, we were watching the most valuable Brewers batter throw to another franchise great.
[/wipes back those tears]
It’s easy to enjoy Prince Fielder’s return to Milwaukee, first and foremost because the slugger was always a joy to watch and one of the club’s best prospects to translate on an MLB diamond. Make no mistake about it, Fielder was an elite slugger with exceptional plate discipline, traits that were often underplayed by fans due to his size and defensive performance. Given that Fielder retired due to an injury, and indeed survived an injury that could have taken a much larger toll on his body, there is a sense with the former slugger that it’s great to see him healthy, happy, and now having a chance to tour his home organization with a victory lap.
Yet, it was not always so rosy with Brewers fans and Prince Fielder. Because of the slugger’s defense, rated approximately 39 runs below average according to the Fielding Runs Above Average (FRAA) stat, and aforementioned size, there was frequent debate a decade ago among Brewers fans about when the Brewers should trade Fielder. Of course, there’s always this type of talk among fans, so some of it should be dismissed as common fan banter (we’re casually debating whether Jesus Aguilar or Domingo Santana should be traded on #BrewersTwitter this year, among other things, so, you know…); but recalling those halcyon days of the SportsBubbler (RIP!) and Journal-Sentinel Online boards, there seemed to be a different edge about Fielder trade talks. Thus, there was a sense, even during Fielder’s most elite seasons in Milwaukee, that many regular, diehard fans underappreciated the patient, disciplined hitter. It was as though, for some odd reason, Brewers fans needed to choose between Braun and Fielder, that the two couldn’t simply coexist as one of the most amazing 1-2 punches in franchise history; indeed, the most valuable 1-2 punch in franchise history.
For a time, it seemed justifiable to knock Fielder down a rung. For one, Fielder exercised his free agency rights by securing a gigantic contract with the Detroit Tigers, and thus had fewer years with the Brewers organization than some of the other franchise greats. Assessed by aggregating Wins Above Replacement Player (WARP), which assesses a player’s batting and fielding performance against the typical “next man up” from the minor leagues, Fielder is a Top 20 Brewers player, but more like Geoff Jenkins than Robin Yount. This summer, here’s what we (thought we) knew about Fielder’s career:
| Best Brewers by Aggregate WARP | Aggregate WARP |
|---|---|
| Robin Yount | 78 |
| Paul Molitor | 64 |
| Ryan Braun | 45 |
| Jonathan Lucroy | 34 |
| Cecil Cooper | 30 |
| Ben Oglivie | 28 |
| Jeff Cirillo | 25 |
| George Scott | 25 |
| Geoff Jenkins | 24 |
| Prince Fielder | 22 |
| Don Money | 21 |
| B.J. Surhoff | 20 |
| Sixto Lezcano | 19 |
| Rickie Weeks | 18 |
| Gorman Thomas | 18 |
| Jose Valentin | 17 |
| Carlos Gomez | 17 |
| Greg Vaughn | 16 |
| Jeromy Burnitz | 16 |
| Johnny Briggs | 15 |
| WARP Aggregated Summer 2018 |
If we recognize that WARP penalizes Fielder (unjustifiably) for leaving Milwaukee and (justifiably) for his fielding, one can rank offensive performance on a season-by-season basis to find the best performers in franchise history. I constructed a Milwaukee Brewers baby-database during the summer of 2018, so I have relatively recent True Average calculations during this DRC+ release week. True Average (TAv) was the old comprehensive offensive metric by Baseball Prospectus, where .260 represented an average performance and the higher the number, the better; it incorporated all sorts of elements of batting performance, but used different weights for situational hitting, parks, strike outs, and other elements than other linear weights methods. Offensively, Fielder stands out much more among the greatest Brewers of all times:
| Brewers Bats by TAV (500+ PA) | Year | Age | PA | TAV |
|---|---|---|---|---|
| Sixto Lezcano | 1979 | 25 | 566 | 0.347 |
| Ryan Braun | 2011 | 27 | 629 | 0.345 |
| Prince Fielder | 2009 | 25 | 719 | 0.342 |
| Cecil Cooper | 1980 | 30 | 678 | 0.341 |
| Robin Yount | 1982 | 26 | 704 | 0.34 |
| Paul Molitor | 1987 | 30 | 542 | 0.338 |
| Larry Hisle | 1978 | 31 | 600 | 0.334 |
| Robin Yount | 1989 | 33 | 690 | 0.33 |
| Prince Fielder | 2011 | 27 | 692 | 0.329 |
| Ben Oglivie | 1980 | 31 | 660 | 0.328 |
| Ryan Braun | 2012 | 28 | 677 | 0.327 |
| Robin Yount | 1983 | 27 | 662 | 0.327 |
| Tommy Harper | 1970 | 29 | 692 | 0.325 |
| Ryan Braun | 2009 | 25 | 708 | 0.324 |
| Cecil Cooper | 1982 | 32 | 696 | 0.321 |
| Prince Fielder | 2007 | 23 | 681 | 0.318 |
| Paul Molitor | 1992 | 35 | 700 | 0.317 |
| Ryan Braun | 2016 | 32 | 564 | 0.316 |
| Paul Molitor | 1991 | 34 | 749 | 0.315 |
| Paul Molitor | 1989 | 32 | 696 | 0.315 |
Even by TAV, Fielder’s greatness might be undermined by the general dominance of Ryan Braun and Paul Molitor in the Brewers Top 20 (four appearances each); Fielder (three appearances) is tied with Robin Yount, which is quite good; Cecil Cooper, Braun, Fielder, Molitor, and Yount comprise 16 of the Top 20 Brewers offensive seasons by TAV.
Deserved Runs Created Plus (DRC+) comes to the rescue and restores Prince Fielder to his rightful place atop Brewers offensive seasons. DRC+ is read on a scale where 100 is average, and the higher the number, the better; 80 means a batter is approximately 20 percent below average, 120 means a batter is approximately 20 percent better than average.
| Top Brewers by DRC+ | Year | DRC Rank | OPS Rank | DRC+ |
|---|---|---|---|---|
| Prince Fielder | 2011 | 3 | 5 | 161.1 |
| Prince Fielder | 2007 | 3 | 6 | 158.1 |
| Ryan Braun | 2011 | 5 | 3 | 157.7 |
| Prince Fielder | 2009 | 2 | 3 | 157.4 |
| Sixto Lezcano | 1979 | 3 | 2 | 156.7 |
| Larry Hisle | 1978 | 6 | 6 | 155.2 |
| Ryan Braun | 2012 | 3 | 2 | 154.2 |
| Ben Oglivie | 1980 | 4 | 5 | 154.1 |
| Robin Yount | 1982 | 2 | 1 | 151.5 |
| Robin Yount | 1989 | 12 | 8 | 142.9 |
| Cecil Cooper | 1980 | 7 | 4 | 142 |
| Don Mincher | 1969 | 16 | 31 | 141.7 |
| Prince Fielder | 2010 | 9 | 22 | 141.6 |
| Gorman Thomas | 1979 | 16 | 19 | 140 |
| Paul Molitor | 1987 | 16 | 3 | 139.3 |
| Gorman Thomas | 1982 | 16 | 27 | 139.2 |
| Richie Sexson | 2003 | 18 | 20 | 138.4 |
| George Scott | 1975 | 15 | 20 | 136.9 |
| John Jaha | 1996 | 23 | 23 | 136.7 |
| Paul Molitor | 1991 | 17 | 11 | 136.5 |
First, let’s take a step back: what is DRC+? DRC+ is the new Baseball Prospectus comprehensive batting metric, which is designed as a sort of “inverse” to Deserved Run Average (DRA), BP’s comprehensive pitching metric. Baseball Prospectus features numerous articles introducing the stat, including this description, and a few advanced discussions of why it should be used (this is good, too. Read everything by Jonathan Judge). The gist of DRC+ is this: once you focus on what is expected at the plate, instead of constructing a basic average of outcomes, you can model run production in a manner that is more accurate, descriptive, and predictive than other metrics. What is interesting is that the batting metrics correlate in many cases, which means that where there are outliers with DRC+, the focus on expected outcomes, different park factors, and other contextual elements could lead to valuable insights into a player’s batting performance.
So back to Fielder, DRC+ launches Fielder to the top of the Brewers franchise, and it’s a rout. By TAV, Fielder was competing with a handful of other batters; with DRC+, he’s competing with himself, clearly a step above all other comers as most valuable bat. What is especially interesting about this new offensive ranking is that the “shape” of the organization’s most elite seasons changes considerably; Fielder now has four Top 20 appearances, which is better than Braun (2), Molitor (2), Yount (2), and (now!) Gorman Thomas (2); Thomas, that Prodigal Wallbanger, did not appear in the Top 20 by TAV, whatsoever, so the DRC+ develop calibrates his career as well.
Why does DRC+ “love” Fielder so much? Let’s look under the hood at those absurd 2007, 2009, and 2011 campaigns. BP publishes DRC+ Run Values, which assess a player’s Runs Above Average (RAA) according to each major batting component that is an element of the DRC+ model. This is a supreme tool, and should be used alongside the basic surface DRC+ statistic!
| Prince Fielder DRC+ Run Values | 1B RAA | 2B RAA | 3B RAA | HR RAA | BB RAA | SO RAA | HBP RAA | ROE RAA | BIP Out RAA |
|---|---|---|---|---|---|---|---|---|---|
| 2011 | -2.8 | 1.4 | -1.5 | 25.9 | 13.9 | 5.7 | 0.8 | -0.7 | 10.2 |
| 2007 | -9.7 | 4.0 | -1.3 | 39.7 | 8.9 | -1.1 | 1.9 | -1.0 | 13.5 |
| 2009 | -6.2 | 2.6 | -0.8 | 33.0 | 12.8 | -2.7 | 0.5 | -0.9 | 17.8 |
So, the obvious, first: Prince Fielder hit some of the most majestic home runs I ever saw, and he also hit some of the hardest laser beams out of Miller Park. But I wish fans took the eye test away from the waistline a bit and watched his batting approach more carefully, for Fielder’s plate discipline was awe-inspiring. Fielder would never get cheated on his first two swings; good grief, it would be difficult to find someone who swung harder on strikes one and two. But don’t mistake those gigantic swings for a lack of discipline, for Fielder also dug in and made pitchers work, and had no trouble waiting for his pitch to drive. To my astonishment, not only does this show up in Fielder’s valuable walk totals (BB RAA), but I also hypothesize that this helps to drive his strong Ball-In-Play Outs (BIP Outs RAA) performance.
Let’s compare Fielder’s very best seasons to those of his contemporary, Braun:
| Ryan Braun DRC+ Run Values | 1B RAA | 2B RAA | 3B RAA | HR RAA | BB RAA | SO RAA | HBP RAA | ROE RAA | BIP Out RAA |
|---|---|---|---|---|---|---|---|---|---|
| 2011 | 4.9 | 4.2 | 2.2 | 21.8 | 2.1 | 5.2 | -0.2 | -0.0 | 5.5 |
| 2012 | 3.0 | 2.1 | 0.3 | 29.0 | 2.2 | 0.8 | 1.2 | -0.5 | 9.9 |
Unlike Fielder, Braun derived more of his run production during his elite seasons from singles, doubles, and triples, rather than home runs and walks. This has a curious outcome on BIP Outs, but it stands to reason that by controlling the strike zone more, limiting balls in play, and maximizing slugging outcomes, Fielder would be able to produce value in that contrarian way (namely, avoiding the batted ball in play). This last line is speculation on my part, and not a reflection of the DRC+ stat, and certainly an avenue for further research (to my mind, the BIP Outs RAA stat is a fascinating aspect of this new stat).
Let’s step back from the numbers: why does any of this matter? If you’re unconvinced about the new stat, think about the eyeball test you used with Fielder during his prime years. How often did you call him a better hitter than Ryan Braun? How often did you compare him favorably to Paul Molitor? How often did you place his elite offensive production at the top of the franchise? DRC+ certainly provides the statistical background to address these questions, and in being openly situated to offensive production through a different lens than other prominent stats, we can revisit our blindspots and perhaps find value that we previously missed. It turns out that Brewers fans may have had Prince Fielder all wrong. Even if your measurement for a baseball stat is to confirm what you already know in most cases, or even if you previously believed that Prince Fielder was an elite batter, there’s room to marvel at just how great he was once more. Take the chance to dig into Fielder’s career again, and maybe revisit some other careers, as well: DRC+ gives us the chance to find some of our other blindspots.
Finding Fielder’s reappraisal is especially sweet because it places an exclamation point on one of the best competitive periods in Brewers franchise history. Fielder sure did the big things loudly, but he also did a lot of things to quietly bolster his production.
Photo Source.