Earlier this week, I covered one underappreciated element of Jonathan Lucroy’s 2015 hardship. Even without taking into account double plays, he clearly came up short — his TAv fell 52 points, from .306 in 2014 to .254 in 2015. For a team that lost 94 games and generally had trouble scoring runs, this only made matters worse. Whatever the Brewers do in 2016 will likely coincide with Lucroy: A bounceback from him will help them rack up victories, while another poor season will doom them to misery once more.
Injuries bore part of the blame for Lucroy’s struggles, as they so often do in cases like this. First a hamstring strain in spring training, then a broken toe in late April, followed by a concussion in September — it seemed as though he couldn’t catch a break. Convalescing in the offseason should bring back some spark to his game; with a healthy leg, toe, and head, he could swing the bat with the authority that he once did.
It’s worth wondering, though, the role that luck — or the lack thereof — played in Lucroy’s 2015. In a world where everyone got what they deserved, how much better would he have produced? Based on some of his peripherals, I’d say a good deal better.
Let’s talk about contact. FanGraphs’ wOBA, while not as useful as TAv, nevertheless does a superb job evaluating a player’s offense. Its publicly-available coefficients also come in handy when we want to create a customized version of the statistic. For this exercise, we’ll utilize “Contact wOBA”, or wOBAc. The formula for this metric, during the 2015 season, is as follows:
wOBAc = (.881 * 1B + 1.256 * 2B + 1.594 * 3B + 2.065 * HR) / (PA – BB – K – HBP)
It’s wOBA without strikeouts, walks, or hit-by-pitches — in other words, wOBA based solely on contact. Whereas BABIP roughly measures a player’s capacity to hit for average and ISO gauges his power, wOBAc combines the two.
What kind of hitters will post a high wOBAc? We’d expect them to be hitters who regularly hit the ball hard. They also shouldn’t pull the ball too much, since that whole shift thing could detract from their output. A regression run with FanGraphs’ Hard% and Pull% yields this expected wOBAc equation:
x_wOBAc = .180 + .730 * Hard% – .072 * Pull%
How does all of this connect to Lucroy? Well, in 2015 he posted:
- A .332 wOBAc;
- A 35.0 percent hard-hit rate;
- A 31.8 percent pull rate; and
- A .410 expected wOBAc.
One of these is not like the others. Someone who consistently drives the ball to all fields, and with force, should see better results than .332 — almost forty points below the MLB-wide wOBAc of .371. Indeed, Lucroy’s 2015 campaign stands apart from the rest:
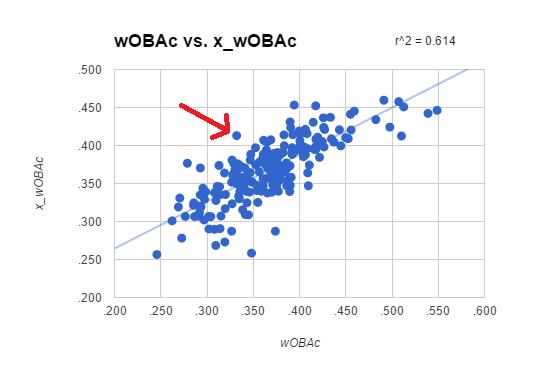
On this graph, which shows the 200 hitters with at least 300 balls put in play in 2015, you can see Lucroy’s lonely dot indicated by the arrow. More mathematically, his residual ranks second in all of baseball:
| Rank | Name | wOBAc | x_wOBAc | Residual |
|---|---|---|---|---|
| 1 | Chase Utley | .279 | .377 | -.098 |
| 2 | Jonathan Lucroy | .332 | .413 | -.081 |
| 3 | Victor Martinez | .293 | .370 | -.078 |
| 4 | Logan Morrison | .313 | .374 | -.061 |
| 5 | Kurt Suzuki | .271 | .331 | -.060 |
| 6 | Matt Kemp | .394 | .453 | -.059 |
| 7 | Juan Lagares | .327 | .381 | -.054 |
| 8 | Omar Infante | .269 | .319 | -.050 |
| 9 | Elvis Andrus | .296 | .344 | -.048 |
| 10 | Aramis Ramirez | .329 | .376 | -.047 |
Utley, of course, has had a season to forget (perhaps preemptive karma for this?), as have Lucroy and Martinez. The gap between them and fourth-place Morrison looms large, suggesting that underperformance to this extent doesn’t occur very often.
One other thing mostly sets Lucroy apart: He theoretically deserved a great output — not just a good one. While the other players listed above (with the exception of Kemp) have expected wOBAcs around average, Lucroy’s ranked 28th in the aforementioned sample. There’s a big difference between a mediocre player who hit poorly and a phenomenal player who hit poorly; if this model accurately appraises true talent, Lucroy falls into the latter group.
As a not-especially-fast catcher, Lucroy will inherently post a lower BABIP and ISO than the average player. He simply doesn’t possess the ability to leg out an infield hit or stretch a single into a double. Thus, perhaps we should expect him to remain below his expected wOBAc in 2016 and beyond. But he does play half his games in a ballpark that generally inflates power numbers, so maybe a bit of overperformance could come around. Whatever happens, I can’t foresee another year of this misfortune.
Even with everything breaking down around (and within) him, Lucroy still managed to hit the ball hard and to all fields. His final batting line might not have shown it, but his talent didn’t disappear. Once the luck dragons decide to breathe their noxious fire on some other poor soul, he’ll hopefully pump his statistics back up, even without a sterling bill of health. Upon doing so, he could help carry the Brewers back to relevance.
Great piece. Love this perspective.