Despite sputtering in the last month of the season, the Brewers succeeded overall in 2014. Kyle Lohse contributed a 1.8 WARP to that effort — his second-consecutive solid year in Milwaukee, following a 2.1-win campaign in 2013. That all came crashing down in year three, as Lohse allowed the second-most earned runs in the National League en route to -1.1 WARP. Hitting the free-agent market at age 37, Lohse may be perilously close to hanging up his cleats.
Interestingly enough, a specific facet of Lohse’s game hardly declined at all — he continued to collect more strikes than his peripherals would suggest:
| Year | Zone% | O-Swing% | xStr% | Str% | Diff | Diff Rank |
|---|---|---|---|---|---|---|
| 2013 | 50.7% | 29.2% | 65.1% | 66.3% | 1.2% | 3rd |
| 2014 | 47.3% | 32.0% | 64.2% | 66.0% | 1.8% | 5th |
| 2015 | 45.8% | 30.4% | 62.3% | 64.4% | 2.1% | 10th |
*Among pitchers with at least 2000 pitches.
Based on Lohse’s rates of pitches thrown in the strike zone and swings outside the strike zone, we’d think he would have thrown 62.3 percent strikes in 2015. He ended up posting a 64.4 percent clip in that regard — lower than in prior years, but still above his expected level.
As my colleague Julien Assouline noted in August, Jonathan Lucroy didn’t frame pitches as well in 2015 as he had in years past. This development manifested itself in Lohse’s CSAA, which roughly measures how many runs a pitcher receives from framing. Per BP’s DRA Run Values, Lohse’s backstops granted him 0.71 framing runs in 2015, compared to 6.14 runs in 2013 and 3.46 runs in 2014. This means that Lohse had less help this year than he did before — and yet he still managed to make calls go his way.
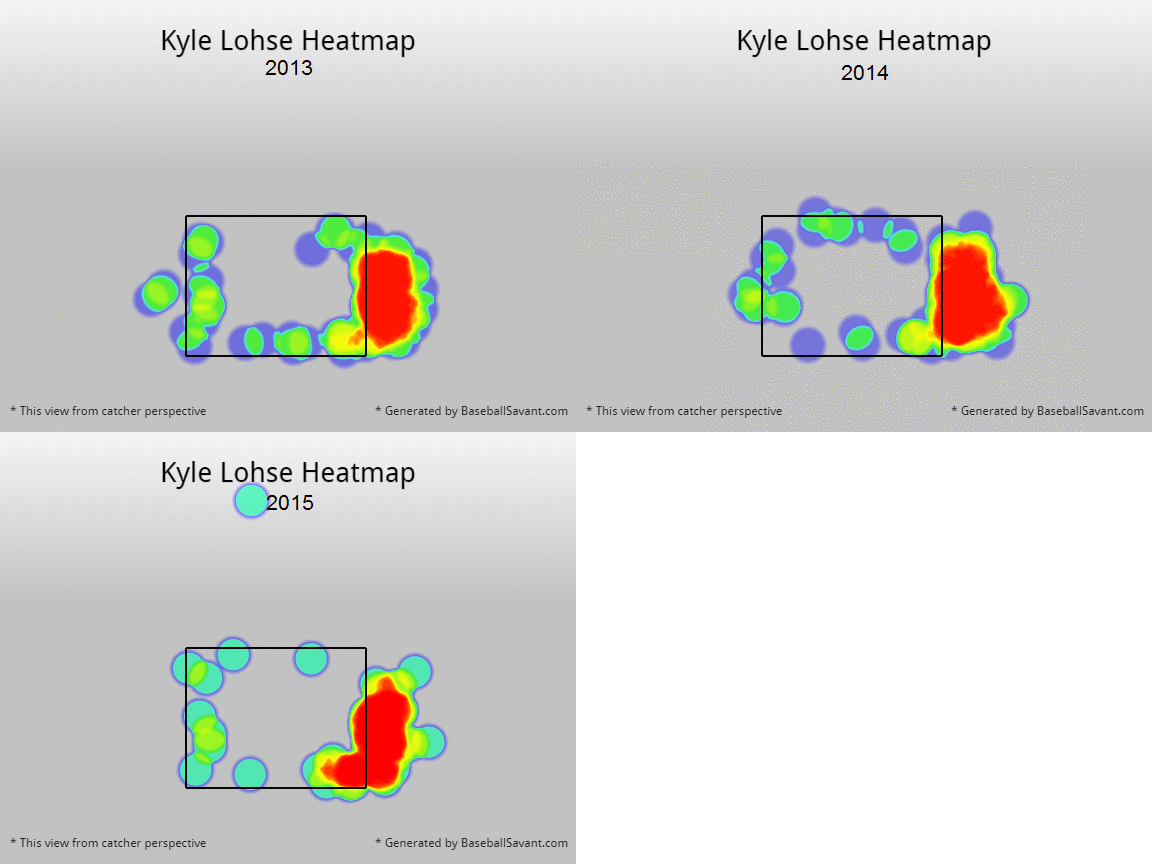
Looking at data from Baseball Savant, we can see that Lohse didn’t change the placement of these extra strikes. This GIF illustrates his called strikes on pitches outside the strike zone against right-handed batters:
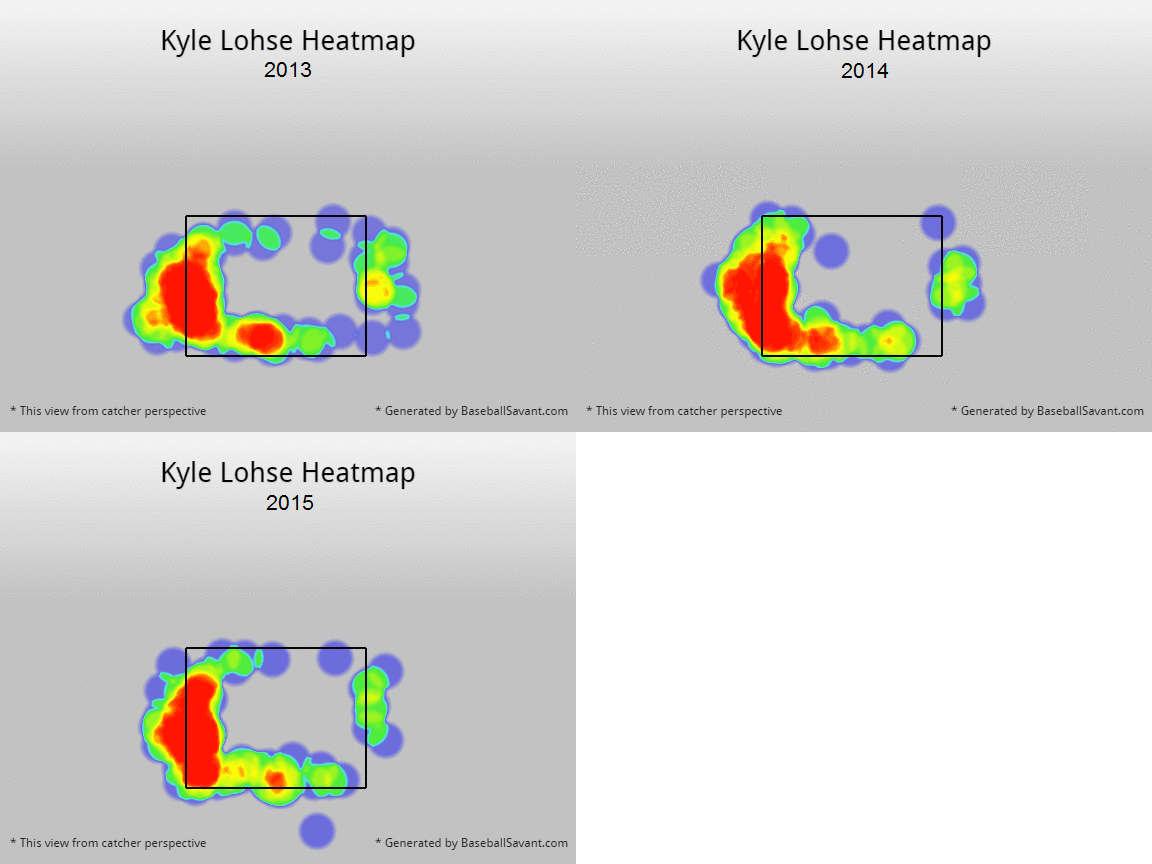
This GIF does the same, for lefties:
Against both breeds of hitter, Lohse maintained the same approach: down and away. The results he had found in the past didn’t abandon him.
Of course, we already know that Lohse’s general effectiveness did abandon him. When a formerly-solid pitcher hits a wall like this — without any loss in velocity or movement, and with no change in strikeouts but a rise in hard contact — people usually attribute it to poor command within the strike zone. This is obviously a tricky thing to measure, since we don’t know where the pitcher intends to throw, but we can still make some general statements about the pitcher. For instance, this trend most likely didn’t help Lohse:
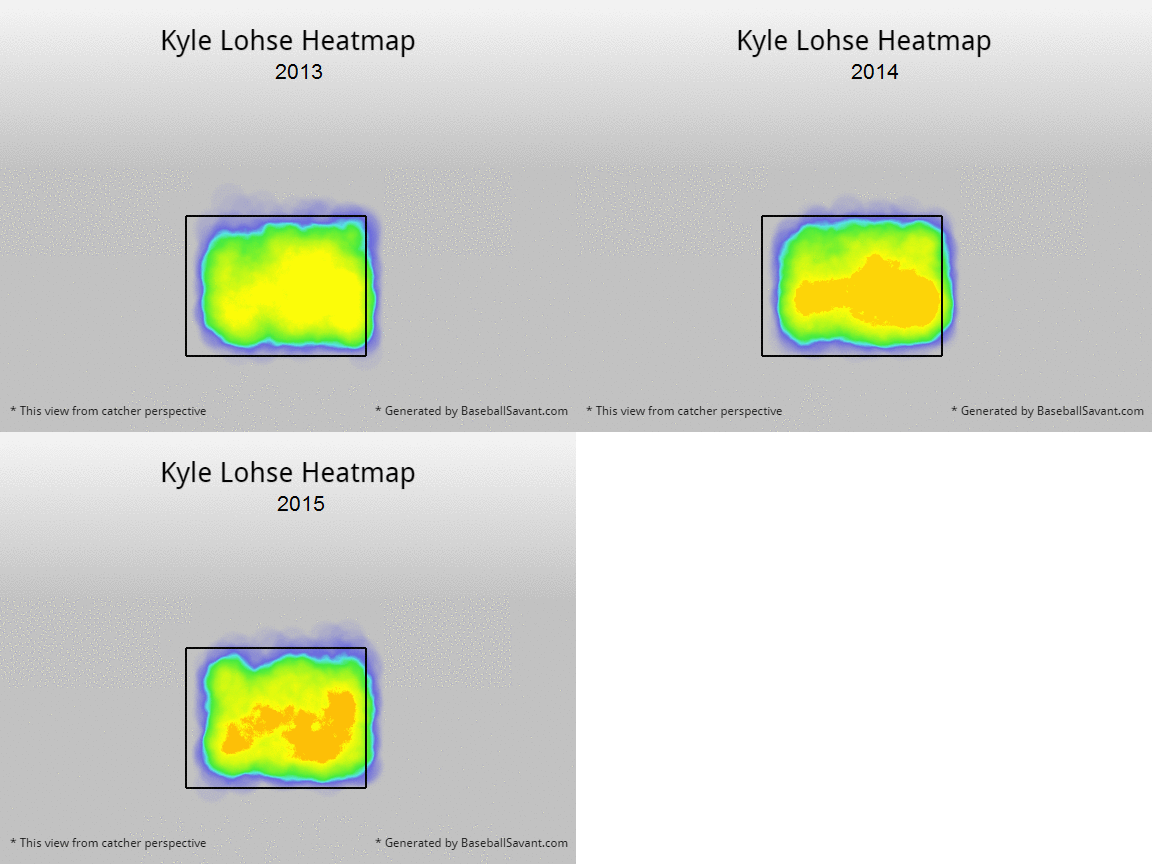
Here, we see all of Lohse’s pitches within the strike zone over the last three years. The darker area — which indicates the location Lohse targeted most heavily — shrunk considerably in 2015, meaning Lohse didn’t distribute the ball as evenly within the strike zone to the extent that he used to. This predictability came around to bite him, as evidenced by his times-through-the-order splits:
| Year(s) | 1st PA OPS | 2nd PA OPS | 3rd PA OPS |
|---|---|---|---|
| 2013-2014 | .685 | .720 | .674 |
| 2015 | .758 | .886 | .937 |
After the first look, hitters got a better idea of where Lohse placed the ball and pounced. Lohse told MLB.com in June that he’d struggled with command; this evidence testifies to that explanation.
Hurlers such as Lohse, who rarely hit 90 with their fastballs and don’t feature many pitches (if any) with plus movement, must command their offerings sharply to thrive. Lohse pulled this off for two years with the Brewers, and to a certain degree he sustained it this year. In the end, though, it’s clear that he has fallen from his perch. Even if they live on the edges of the strike zone, no pitcher will perform well with this kind of command within the zone.


