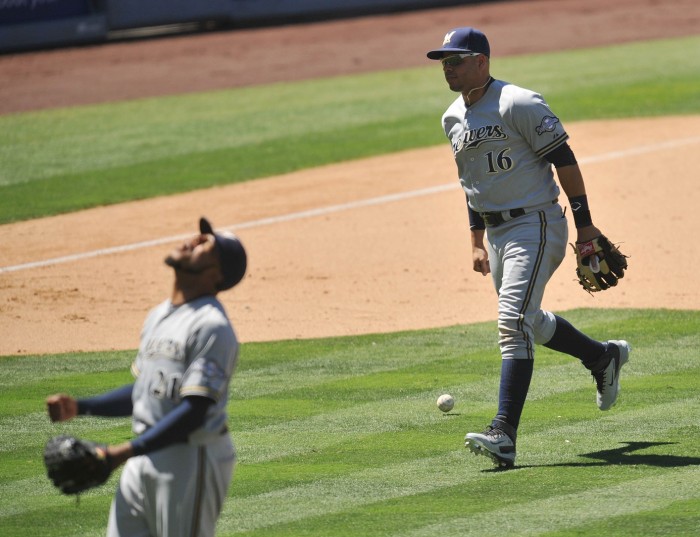
Baseball statistics can be broken up into two general categories: run scoring and run prevention. The Brewers’ run prevention has traditionally not been their strong suit. Even when the team was consistently good, they tended to win games by bludgeoning teams. This year, that trend continued, as they finished 24th in runs allowed as a team (this is, of course, not a perfect measure and does not take into account park factors).
The temptation is clearly to blame the pitching staff, but the pitchers are not solely at fault. Pitchers cannot strike every hitter out, so they are reliant on their defense to turn batted balls into outs — and the Brewers were not good at that either.
Logically, one would expect a team’s overall defensive efficiency (percent of balls in play turned into outs) to mirror its individual defensive talents, and there is in fact a strong correlation (approximately 0.67) between a team’s defensive efficiency and its cumulative DRS (per B-R). This correlation is not perfect, though. There is, in fact, some room for error.
Some of that variance is likely just noise. Defensive metrics remain highly volatile, and metrics such as DRS have not completely figured out how to address players who are shifting and, therefore, not in a normal starting position. Additionally, while defensive efficiency is a cut-and-dried number that is actually well-suited to measuring a team’s overall defensive output, cross-team comparisons are difficult because of differences in ballparks. We are also faced with the familiar problem of measuring defense: How much blame/credit is assigned to pitchers’ ability (or inability) to suppress hard contact?
Even with all of those caveats, though, the comparison between defensive efficiency and team DRS is valuable because it can help shed light on which teams are best utilizing the talent they do have. In the case of the Brewers, it is particularly telling because of the statistics of the teams around them.
For the full 2015 season, the Brewers had a combined team DRS of -7. The three teams closest to Milwaukee in that statistic were Cincinnati (also -7), Washington (-6), and Baltimore (-9). Each team, though, had a defensive efficiency better than the Brewers, which indicates that they were able to use their similarly subpar defenders to turn more balls into outs.
| Team | DRS | Def Eff |
| Milwaukee | -7 | .679 |
| Baltimore | -9 | .691 |
| Cincinnati | -7 | .689 |
| Washington | -6 | .685 |
[Data courtesy of Baseball-Reference]
This analysis does assume we use defensive efficiency as the ultimate arbiter of team defensive performance, but I think such an assumption is justified. The metric itself is not perfect; a defense’s job is to get outs, and a strikeout is the surest way to accomplish that job but is not included in the measurement. This does, however, account for shifts by focusing solely on the number of balls turned into outs rather than tracking a particular player’s starting point. Additionally, while the differences involved may seem very small (down to three decimal points), the sheer number of chances each full team has (approximately 6,000 per team) means that these distinctions are in fact significant.
The Brewers are unlikely to greatly improve their individual defensive talents in 2016. After all, Gerardo Parra contributed part of their 2015 numbers, and he is no longer with the team. Additionally, six of the eight position player spots are mostly accounted for already, and those players were the same ones who accumulated the lousy 2015 numbers.
Of course, there are many caveats to this data. Many of them were covered above, but I believe this is still interesting and fascinating information. The hope will be that the Brewers’ new front office will encourage the field staff to be more flexible and get more defensive production out of the personnel they already have.
