Once a player has played for a couple seasons or so at the major-league level, we can conclusively say some things about their abilities, and their shortcomings. With a large enough sample, the Dennis Green Rule goes into effect: Players will be who we thought they were. Jimmy Nelson, for instance, will probably always struggle against left-handers, who have a .308 multi-year TAv against him. Chris Carter should continue to pile up the strikeouts, as he’s done in 33.4 percent of his career plate appearances. Although these flaws won’t necessarily sink these players, they will stick around, in all likelihood.
With that said, “all likelihood” doesn’t cover every scenario. In the 2009 offseason, the Brewers traded for a scrawny outfielder who had never hit for power — he’d posted a lifetime ISO of .114 in the majors and .100 in the minors. But after a few years of development, Carlos Gomez started to smack the snot out of the ball. During his five-plus seasons in Milwaukee, he earned an ISO of .186. This leap, while uncommon, does happen from time to time, and we may witness a similar transformation with Scooter Gennett.
In the minor leagues, Gennett did not take walks. Across five seasons and 2,336 plate appearances, he worked his way to a free pass 5.6 percent of the time. In the major leagues, Gennett had not taken walks. Over his first three seasons in the show, he had gone to bat 1,095 times, 4.0 percent of which ended in a walk. This, it seemed, was simply Gennett’s profile — an aggressive, low-walk hitter.
2016 has destroyed all of that. Thus far, Gennett has racked up nine walks in 47 plate appearances, for an incredible 19.1 percent walk rate. Is there any precedent for this in his past? I’ll let this amazing graph answer that question:
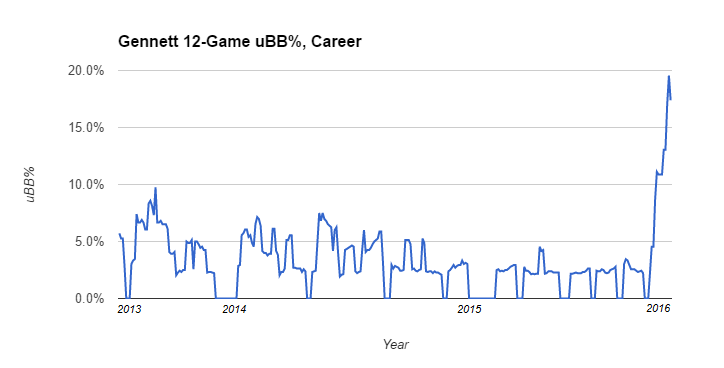
Gennett has played in all 12 games in 2016, so this graph looks at his 12-game rolling average unintentional walk rate throughout his major-league career. Not only has he never done this before, he’s never come close to doing this before. Prior to this season, his highest 12-game clip was 9.8 percent, back in August 2013. To put it another way: There are 321 of these 12-game chunks (since he’s played in 332 games total). In 62 of those periods, he took zero walks — that’s almost one out of every five! Suffice it to say that Gennett has never experienced anything like this.
So what’s behind it? Perhaps because of his three home runs (!) which lead the team (!!!), Gennett has a 47.3 percent zone rate in 2016, per FanGraphs’ data. That’s a moderate dropoff from his previous zone rate of 48.7 percent, and it probably has something to do with the spike in walks. But the biggest reason for his improvement is what you’d suspect — he’s chasing a lot less often. Gennett swung at 42.3 percent of pitches outside the strike zone before this season, the fourth-highest level in baseball. To this point, he’s cut that down to 27.1 percent, which ranks 83rd out of 197 qualifiers. In terms of discipline, Gennett has gone from the bottom of the barrel to the middle of the pack, a change that has inflated his walk rate.
Gennett has made the most progress in one particular area: outside pitches. Let’s look at some numbers from Baseball Savant. From 2013 to 2015, 166 left-handed batters saw at least 1,000 pitches in zones 11 and 13 (here‘s the zone from the catcher’s perspective). On average, they offered at 29.8 percent of those pitches; Gennett swung at 35.3 percent, placing 137th. Now we’ll move ahead to 2016, in which we’ll lower our threshold to 40 pitches, giving us a 120-player sample. Where does Gennett slot in among these hitters?
| Rank | Player | O-Swings | O-Pitches | O-Swing% |
|---|---|---|---|---|
| 1 | Chase Headley | 2 | 47 | 4.3% |
| 2 | Joe Mauer | 13 | 100 | 13.0% |
| 3 | Scooter Gennett | 11 | 82 | 13.4% |
| 4 | Angel Pagan | 12 | 80 | 15.0% |
| 5 | Jarrod Saltalamacchia | 6 | 40 | 15.0% |
| 6 | John Jaso | 13 | 84 | 15.5% |
| 7 | Francisco Lindor | 8 | 51 | 15.7% |
| 8 | Brett Gardner | 12 | 72 | 16.7% |
| 9 | Jonathan Villar | 10 | 59 | 17.0% |
| 10 | Jed Lowrie | 13 | 76 | 17.1% |
Much higher. Higher than Carlos Santana (19.7 percent); higher than Joey Votto (26.2 percent); higher than, well, pretty much everyone. And this change reverberates elsewhere in Gennett’s offense. Since he swings less often at pitches away from him, that means he swings more often, comparatively, at pitches close to him; this has increased his pull rate to a career-high 42.9 percent. As a hitter who does much better when hitting to right field — he has a lifetime pull wRC+ of 164, compared to 119 to center and 118 to right — Gennett benefits from this adjustment in more ways than just walks.
The big question here, as is always the case with April breakouts, is sustainability. Most of the time, when a Gomez-type player starts hitting for power, or when a Gennett-type player starts taking walks, it’ll vanish pretty quickly. But the underlying plate discipline changes add some credence to his case — those are on a per-pitch basis, as opposed to per-plate appearance, so they’ll stabilize much quicker. While Gennett won’t sustain a Bonds-esque 19.1 percent free pass rate, a higher walk rate should be in order. Before the season, PECOTA projected 25 walks in 592 plate appearances, for a rate of 4.2 percent. Now, it predicts a 5.1 percent clip in his remaining 548 trips to the dish. The longer Gennett keeps this up, the more the projections will come around to his side.
Gennett’s transformation has epitomized that of his team. Once a squad full of free swingers, the Brewers have become one of the more patient clubs in the majors, for better or for worse. For Gennett, though, the change certainly seems like a worthwhile one. The old Gennett swung at everything, and that approach generally didn’t pay off; the new Gennett has swung a lot less, especially at bad pitches, and that’s made him one of the best Milwaukee hitters. Every major leaguer tweaks his game constantly, looking to correct his flaws and reach his potential; maybe Gennett can now fulfill his.
All data as of Monday, April 18.
3 comments on “Scooter Gennett Takes Walks Now”