It’s halfway between the actual halfway point of the baseball season and the de facto halfway point, so it’s time to take a look at what we think we know about the Brewers based on when stats begin to stabilize.
The usual disclaimer here applies, in that these stats aren’t meant to be taken as absolute gospel moving forward, but rather begin to become predictors of future performance based on Russell Carleton’s research.
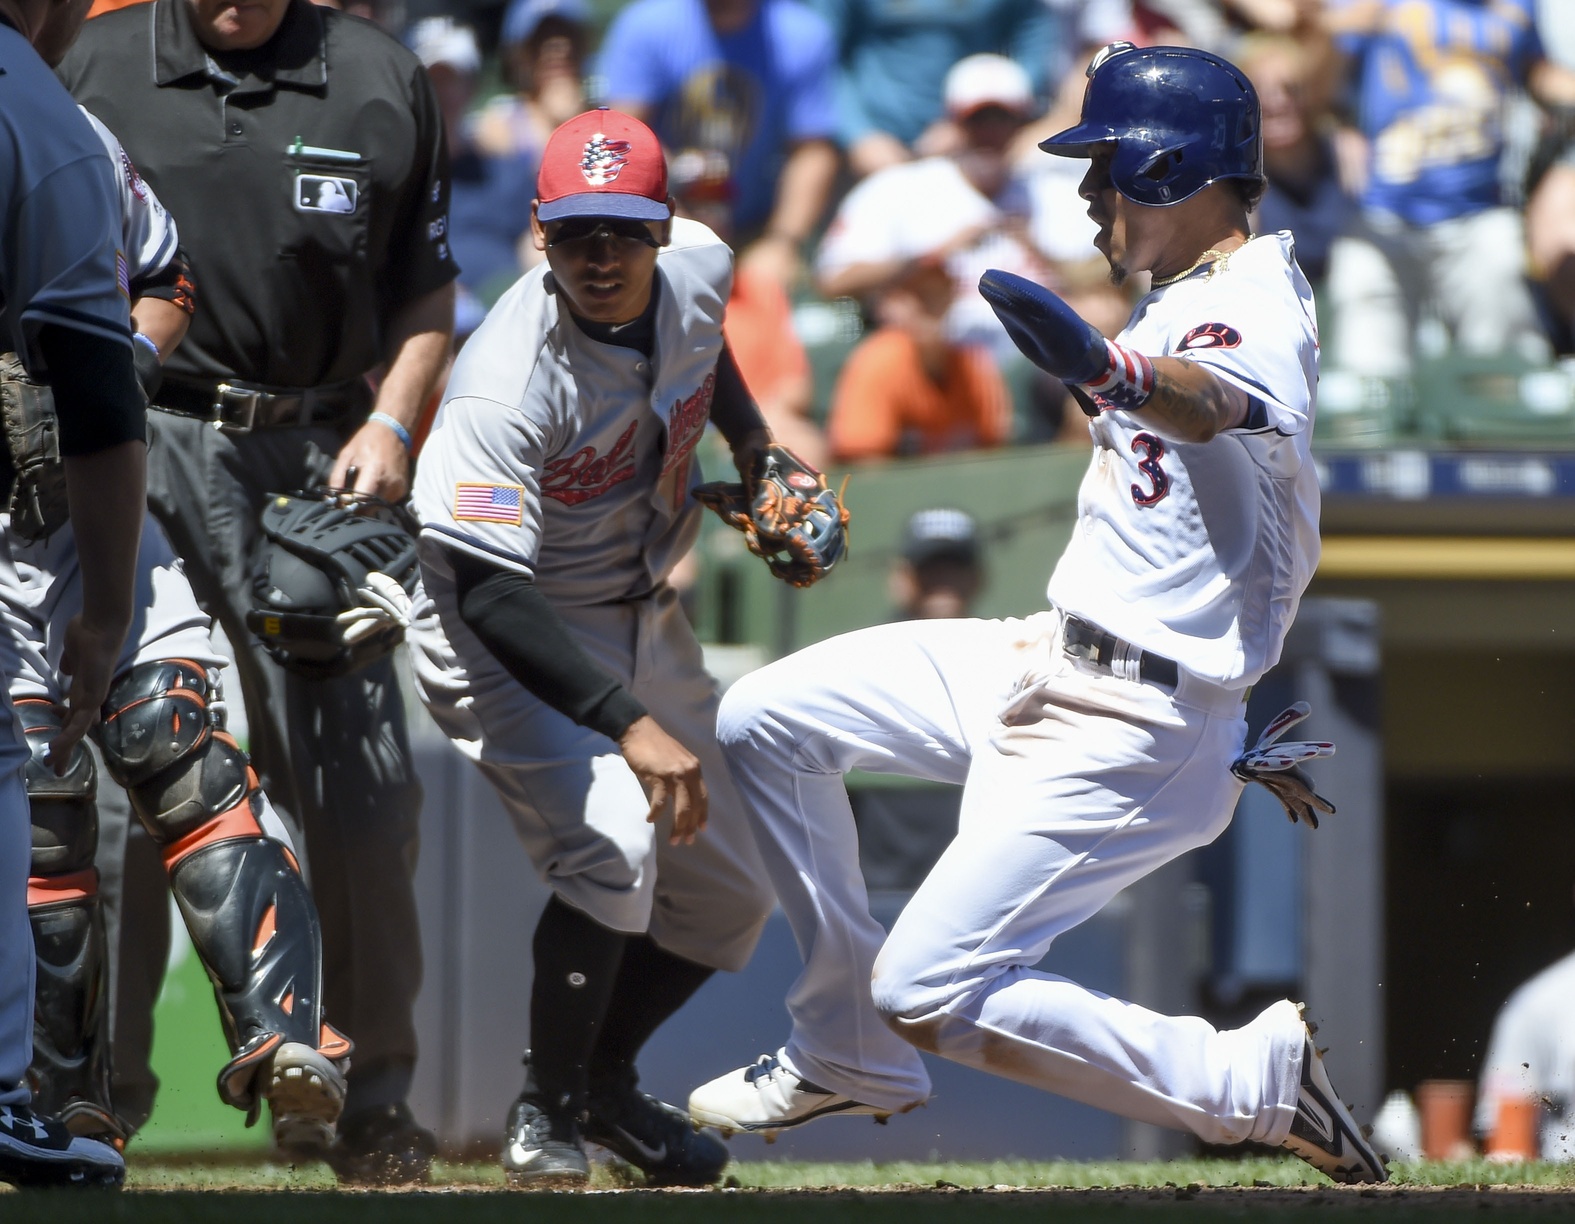
Travis Shaw is the Truth
As the season goes on, the price the Brewers paid for Travis Shaw becomes more and more amazing. Beyond his .299 TAv through July 3 while playing above-average third base (1.5 FRAA), he has been worth 2.6 WARP already for the Brewers.
His outstanding year has largely come from his power, as 73 games in 2017 have already produced a career high in home runs. He’s riding an MLB career- high in BABIP, but the power does seem to have some indications of being real. Home run rates stabilize after 170 plate appearances, and out of all MLB hitters who have reached that mark so far, Shaw ranks 27th in all of baseball with 5.48 percent of his turns at the plate resulting in a round tripper.
His walk and strikeout numbers also continue to make steady progress, as you might expect from a 27 year-old getting his first true full-time shot against major league pitching. The concern with Shaw has always been his susceptibility to left-handed pitching, and at least in the early going (statistically speaking) of the season, Shaw has answered that challenge capably. His strikeout rate against lefties has declined from 27 percent with Boston last year to 24.7 percent this year. While he doesn’t yet have enough plate appearances in against lefties to predict a long-term change to his walk rate, that will be something to keep an eye on moving forward, as he’s walking at a 6.5 percent clip against lefties, compared to a career average of 4.7 percent.
To date, Shaw has produced the most value to the surprising Brewers’ season. He’s a key part of the foundation this year, and is likely to be one of the team’s most valuable assets moving forward, even baking in significant regression for the rest of the year. If he matches his PECOTA-projected 1.2 WARP for the rest of the season, the Brewers will have found themselves a 4-win third baseman that should produce at the hot corner for seasons to come.
Orlando Arcia Continues to Progress
That’s a boring headline for a really exciting thing happening before our eyes. I wrote in May that Arcia was exactly where he should be as a young shortstop, and his hitting has only progressed from there.
He’s up to a .267 TAv so far, with a .295/.334/.440 line on the season. His recent performance is largely fueled by a .406 BABIP in June while his professional career’s season-high BABIP of .343 was in 2015 in Double- A. But beyond the great glove (a whopping 8.5 FRAA, good for 13th in all of baseball in 2017), and above-average production with the bat among shortstops so far, there are indicators that Arcia is progressing with the strike zone as well.
Below are two graphs. The first is from Arcia’s career average swing rate through May this year. The second shows his swing rate from June 1 through the games on July 3.
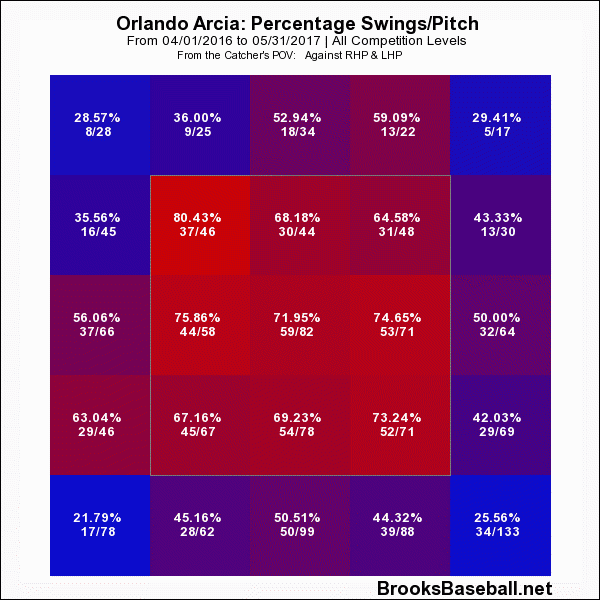
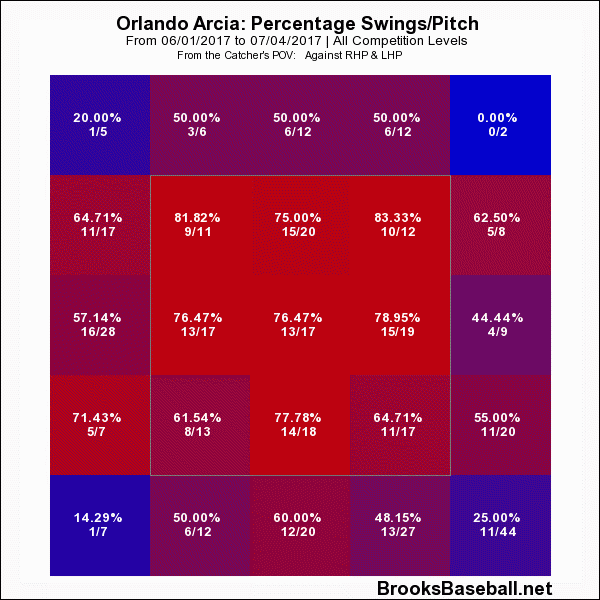
Arcia still swings at an awful lot of pitches, but he’s increased his swings right in the heart of the strike zone in the past month. Time will tell if he’s adjusting his approach as he gets more experienced, but certainly you’d prefer to see this trend for a young player over the other way.
And while it’s positive to see a player swing at more pitches in the strike zone (mental note for my kid’s coach’s pitch league team speech coming up), Arcia is also making more contact and whiffing less at those pitches he’s offering at, especially in the heart of the zone. From the same time frames:
Arcia is rightfully becoming a fan favorite– both on and off the field. While he’s still incredibly young, he’s already producing like an all-star when you combine the glove and the bat for the position. He may continue to make strides at the plate, and has started to show glimpses of Milwaukee’s (hopefully) long-term fantastic future at the shortstop position.
The Pitching Staff is About League Average in Pace
For the season, the Brewer pitching staff is above league average, both with the bases clear and with men on base.
| Bases Empty | Runners On | |
| Brewers PACE | 18.85 | 25.75 |
| MLB PACE | 18.90 | 25.17 |
Among current starters, Zach Davies is almost 3 seconds faster than the next-quickest pace of Chase Anderson’s 18.2. Davies also slows the pace way down when he has runners on, by an average of 9.7 seconds, which also leads the team.
The slowest pace on the team among starters belongs to Matt Garza, who takes 23.65 seconds between pitches, on average.
There isn’t too much to read into this, unless I guess you have to get somewhere right after a Brewers game, but I found it interesting nonetheless. The full PACE numbers so far for Brewer pitchers:
| NAME | PITCHES | PACE | PITCHES_EMPTY | PACE_EMPTY | PITCHES_ON_BASE | PACE_ON_BASE | diff |
| Zach Davies | 916 | 19.697 | 525 | 15.531 | 391 | 25.289 | -9.758 |
| Paolo Espino | 191 | 19.419 | 108 | 15.907 | 83 | 23.988 | -8.081 |
| Tommy Milone | 325 | 19.443 | 206 | 15.966 | 119 | 25.462 | -9.496 |
| Wily Peralta | 573 | 21.056 | 355 | 18.023 | 218 | 25.995 | -7.972 |
| Jared Hughes | 266 | 21.083 | 142 | 18.07 | 124 | 24.532 | -6.462 |
| Chase Anderson | 792 | 21.231 | 500 | 18.2 | 292 | 26.421 | -8.221 |
| Jimmy Nelson | 760 | 21.276 | 495 | 19.049 | 265 | 25.438 | -6.389 |
| Junior Guerra | 431 | 23.167 | 248 | 19.395 | 183 | 28.279 | -8.884 |
| Jacob Barnes | 352 | 21.815 | 233 | 19.588 | 119 | 26.177 | -6.589 |
| Oliver Drake | 342 | 21.529 | 203 | 19.833 | 139 | 24.007 | -4.174 |
| Neftali Feliz | 315 | 21.886 | 209 | 20.407 | 106 | 24.802 | -4.395 |
| Corey Knebel | 401 | 22.791 | 247 | 20.567 | 154 | 26.357 | -5.79 |
| Matt Garza | 542 | 23.649 | 350 | 21.491 | 192 | 27.583 | -6.092 |
| Rob Scahill | 140 | 24.15 | 65 | 21.908 | 75 | 26.093 | -4.185 |
Manny Pina Has the Best Nickname in Brewers History
Pineapple Express. Don’t @ me.
Photo Credit: Benny Sieu, USAToday Sports Images