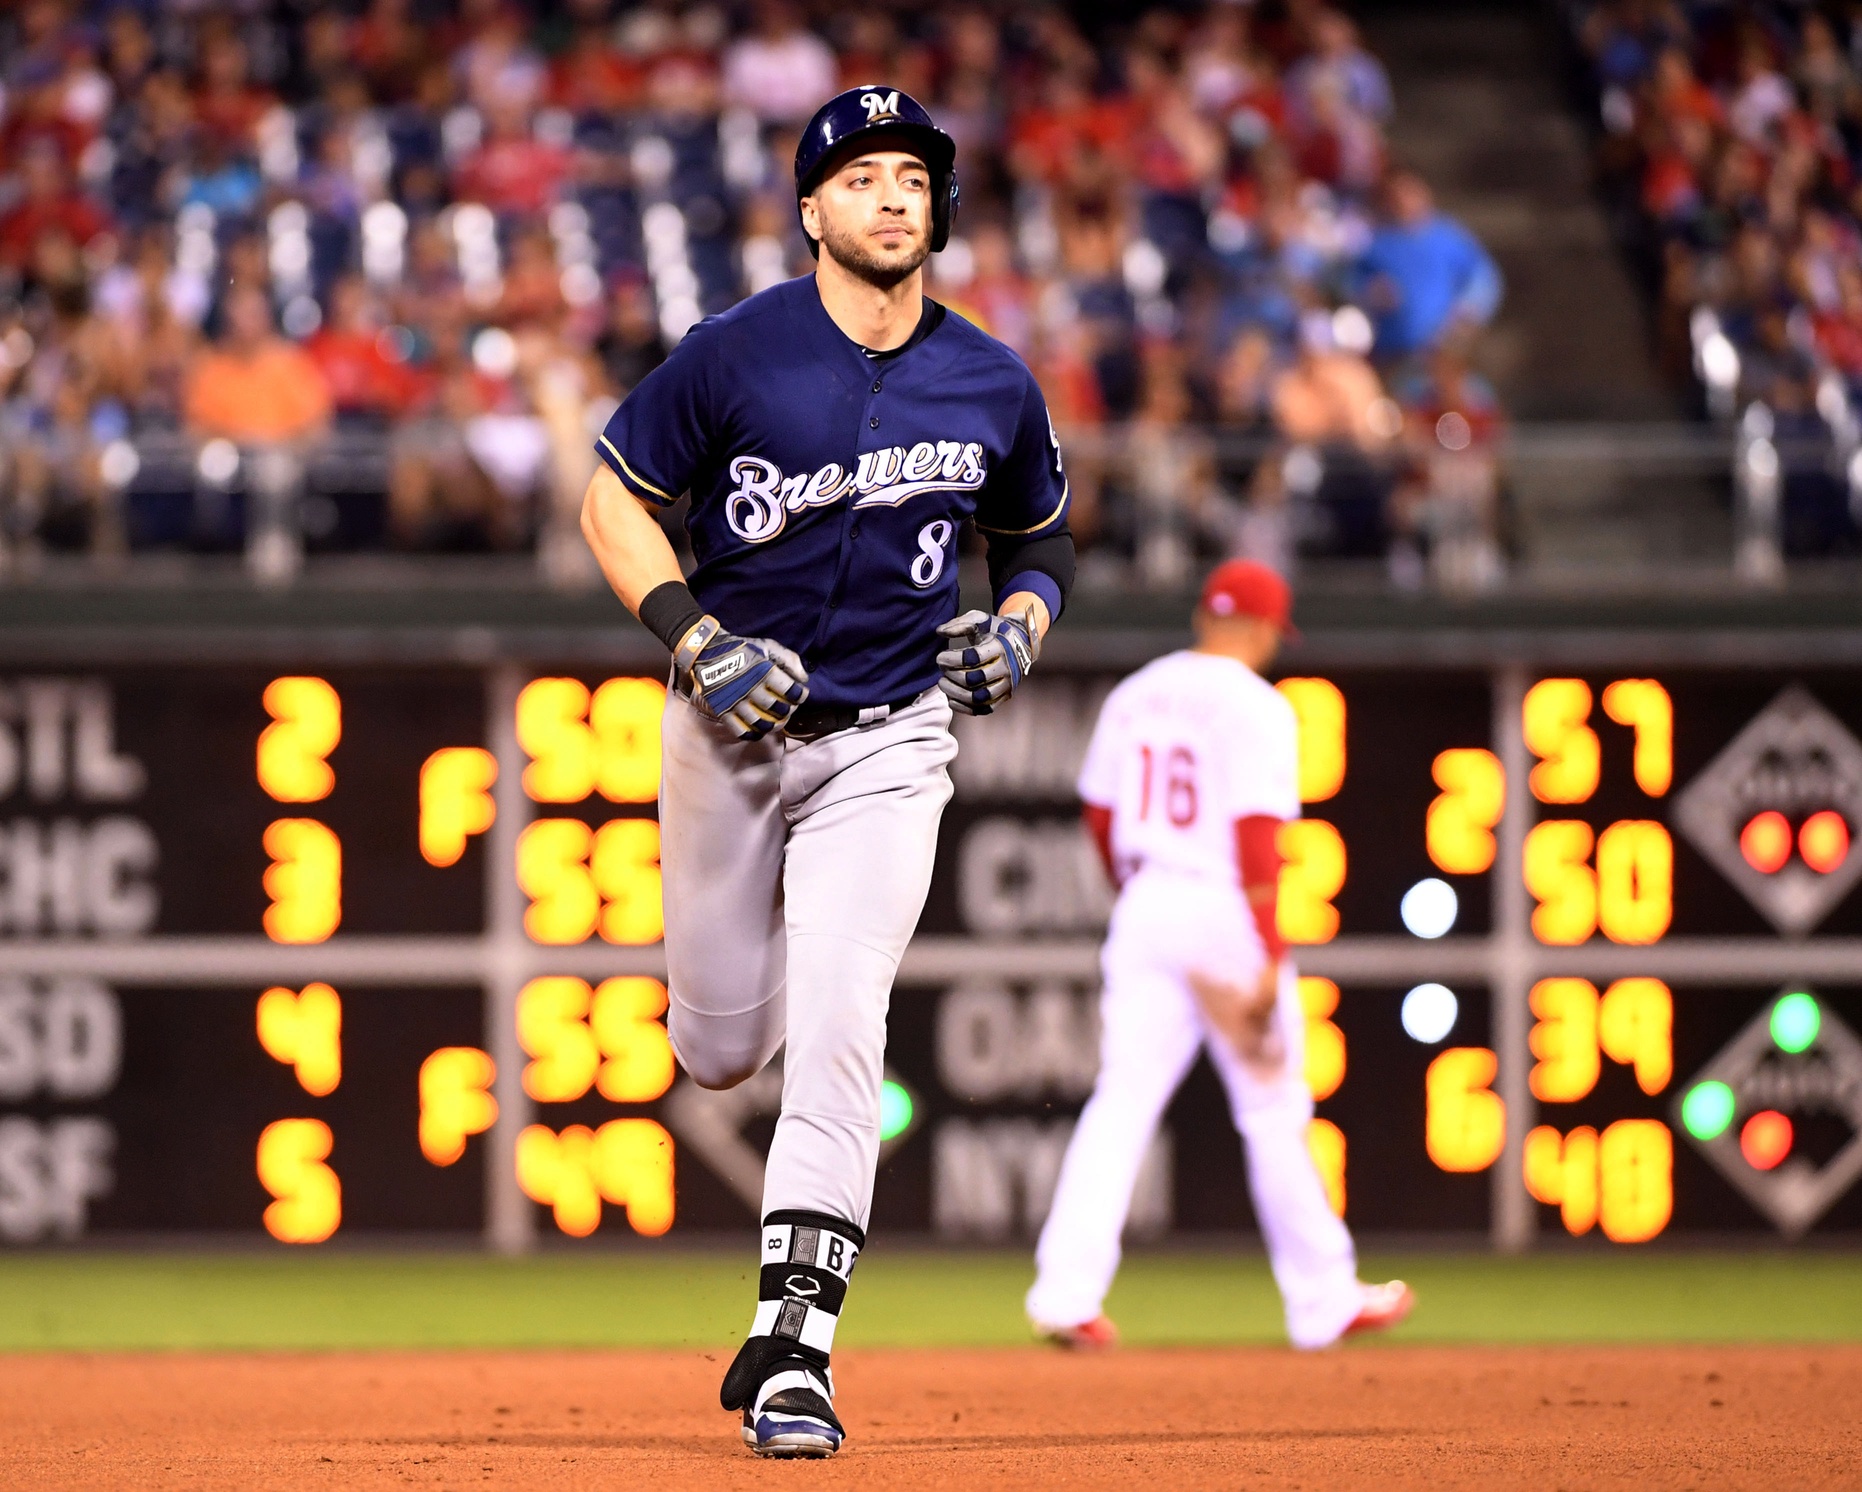
It’s no secret that the past week has been a veritable Pennsylvania house of horrors for the Brewers. Between July 15 and July 21, the Brewers went 1-6 against the Keystone State. And while there’s plenty to reassure Brewer fans that this is just part of the ups and downs of every season, one particular component of the Brewers’ offense bears examining further.
First, the good news. Using Fangraphs’ handy “past 7 days” split tool, we know that the pitching has been about average over that time frame, in both ERA and FIP. And that’s without the top-line relievers getting as much work in as you might expect.
So we turn our attention to the offense.
| Brewers | PA | BB% | K% | OBP | BABIP |
| Season | 3772 | 8.5% | 25.5% | .324 | .311 |
| 7/15-7/21 | 257 | 6.2% | 30.7% | .296 | .342 |
The hitters have been walking less and striking out more, but are also running a much higher batting average on balls in play than you might expect during a slump. Perhaps the players are pressing a bit to keep the offense going with Ryan Braun in and out of the lineup as of late, or (more likely) it’s the random fluctuations of any 7-day stretch that a team will go through. Nothing too unbelievable about these numbers within a week’s games. The plate discipline data over the past 7 days seems to back this up, too. The Crew hitters are making contact on 74.5 percent of swings over the past week, and have a season average of 74.6 percent.
Looking at the batted ball data, however, shows one extreme outlier.
| Brewers | LD% | GB% | FB% | IFFB% | HR/FB |
| Season | 20.7% | 47.1% | 32.2% | 7.7% | 18.8% |
| 7/15-7/21 | 17.5% | 51.9% | 30.6% | 6.1% | 12.2% |
Most of the batted balls are within a few percentage points of the season average, but the percentage of fly balls leaving the yard is down by more than a third over the past week. Now, the 12.2 percent by itself isn’t cause for alarm, given that it’s, you know, a week of games.
What’s striking (no pun intended) though, is just how far above the norm Brewer hitters have been when it comes to having fly balls go for home runs so far this season.
| MIL 2017 HR/FB | MLB Average | Standard Deviation |
| 18.8% | 13.71% | 2.1 |
The Brewers up through July 21 are a standard deviation more than the second-place team in baseball, the Rays. They’re more than that away from the full-season HR/FB high mark from the past three years, the 2016 Orioles with 15.6 percent.
So while nobody can expect the Brewers to hit as many homeruns as they have, it’s at least notable that the team’s home runs per flyball over the past 7 days have been closer to what we can expect moving forward than the team’s season-to-date performance.
There’s still no reason to panic over a week’s worth of games. The Brewers remain overall, in good shape and the projections certainly have regression in the homers baked in. With most of the trade rumor mill centering around Milwaukee acquiring a pitcher, the Brewers shouldn’t overlook that the offense likely has some regression coming in at least one small way.
Photo Credit: Eric Hartline, USAToday Sports Images
