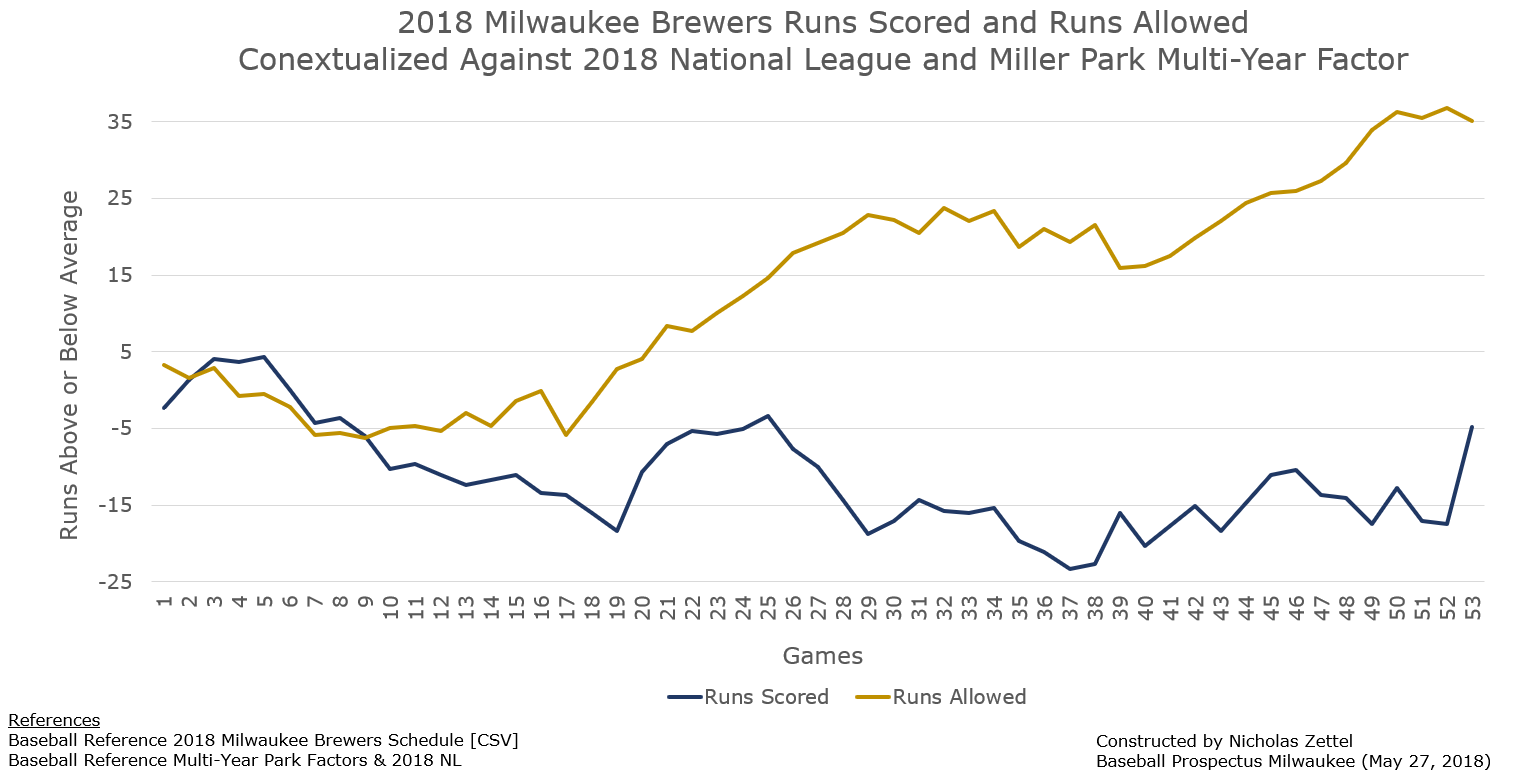
Entering Sunday, the Brewers bats had posted their best offensive output of the season, a runs scored total so large that a mediocre-to-bad offense suddenly had a much more positive season trend (or at least closer to average). Our Beloved Milwaukee Nine extended a four game lead over the nearest National League Central rivals w, and boasted the very best record in the National League. But the Pythagorean W-L, otherwise known as an expected Win-Loss Record based on a team’s Runs Scored and Runs Allowed (“Run Differential”), did not budge for the Brewers: the Brewers were still outplaying their run differential by three wins, giving the sense that for all their strengths there remain questions about the quality of this Brewers club. Yet, even if the team is not the runaway favorite for the NL Central Championship, one gets the sense that their elite fielding and bullpen combination should keep them in the mix for a Wild Card spot on the Senior Circuit.
| 2018 Brewers | Runs Scored | Runs Allowed | Expected W-L | Actual W-L |
|---|---|---|---|---|
| March / April | 113 | 107 | 16-14 | 17-13 |
| May | 120 | 93 | 17-7 | 15-9 |
| Pace | 699 | 600 | 93-69 | ??? |
Since it was so much fun last year, the Daily Pythagorean feature remains a constant on BPMilwaukee Twitter. However, this year the results generate much less excitement, simply because I think this year’s Brewers fans have much higher expectations for the club.
Even after a major correction game (!!!), the #Brewers (33-20) still over play their run differential by three wins (30-23). Milwaukee is on pace for approximately 90 wins (-15 RS / +107 RA).
— BP Milwaukee (@BPMilwaukee) May 27, 2018
Last year, it was genuinely exciting to see the surprise rag-tag chumps challenge the National League, and it was joyful to see that the club was pretty much on target for a true 84-85 win pace throughout the season (which they eventually cashed in, and more). This year, there might be a bit more dread in the Daily Pythagorean: an elite pitching staff indeed leads the club, but a month of brutally cold bats (like, truly worst in the league offensive style), coupled with a team that must win every close game in order to succeed (often due to razor’s edge RS / RA margins) means that this team has much worse average performances than the 2017 Brewers.
Basically, the purpose of constructing a Daily Pythagorean W-L model is to analyze variance across the course of 162 game seasons. While analysts frequently use run differentials to present a general status update of ballclubs, upgrading that analysis to a daily metric allows one to average club’s run differential across the course of 162 games. The benefit of this model is that one can also construct an internal Standard Deviation, which is one potential metric for capturing internal variance of a ballclub. By constructing Daily Pythagorean assessments of multiple teams, one can come to understand how variance occurs across different baseball teams (I did this with an assessment of Playoff teams and contenders in the expanded Wild Card era). Thus one can indeed compare point-in-time RS / RA and W-L and use run differential expectations to gauge a team’s “true potential” at a glance, but by averaging results over the course of an entire season, one can also come to understand the general trends of a ballclub. This involves actual W-L, actual RS / RA record, average W-L, and average RS / RA record, as well as the standard deviation for any metric that reflects an average measurement.
| Daily Pythagorean | 2017 Brewers | 2018 Brewers (Thus Far) |
|---|---|---|
| Average RS / RA W-L | 85 | 80 |
| Standard Deviation | 5.1 | 12.4 |
| Average W-L | 83 | 98 |
| 53 Game RS / RA W-L | 90 | 90 |
| 81 Game RS / RA W-L | 85 | ??? |
| Actual Wins | 86 | ??? |
Fully one third of the way through 2018, this Brewers team is completely different than last year’s club despite many surface similarities:
- First and foremost, the 2018 Brewers are thoroughly out playing their underlying run differential, while the 2017 Brewers under performed throughout the vast majority of the season. In 2017, the Brewers under played their run differential for 91 games, and matched it for seven games; by contrast, the 2018 Brewers have over played their run differential throughout the entire season thus far. In fact, the 2018 Brewers have not once matched their Pythagorean W-L (thus far).
- Through 53 games, the 2017 Brewers actually produced a better than average offense, with a typical +11 RS mark for the first 53 games; by contrast, the pitching was average through the first third (+1 RA). However, those marks completely changed by the end of the season, as the bats fell to -17 RS while the pitching surged to become one of the best staffs in the NL. These year-end figures are following suit in 2018 thus far, with the club averaging -11 RS and +13 RA through 53 games. Thus, it is worth looking at the run differential switch that occurred in 2017 (fully materializing around Game 114) and questioning the overall path of the 2018 bats and arms.
- Perhaps most importantly, the 2017 Brewers exhibited astonishingly low variance. In fact, their run differential Standard Deviation was lower than every 2017 playoff contender except for the Cubs. The 2017 Brewers were exactly who they were: With a window of 80-to-90 wins averaged throughout the season, there was a very clear idea of where the 2017 Brewers would land. This is decidedly not the case in 2018, where the Brewers are averaging an 80 win run differential with a huge standard deviation (12 wins). This is a large standard deviation even for early season analysis (for example, only the 2017 Dodgers and 2017 Twins exhibited higher early season variance). Basically, the Brewers could be a 68-win club, or they could be a 92-win club, given their average underlying elements.
Let’s look at this in detail, for I gather that many fans will not be happy thinking about a 68-win 2018 Brewers club at this point. But, it fits the balance of the club’s characteristics: Milwaukee is using an elite bullpen to dominate close games, but it’s not difficult to imagine a very good bullpen losing a few more close games after a struggling offense fails to pick up a blown lead. This scenario does not even require the Brewers relievers to be bad; it just requires the distribution of outcomes to spin in a different direction than those witnessed thus far (which is an exceptional 14-5 record in one-run games). The club could simply face close-game fatigue, as they are currently on pace to play 57 one-run games. Should that success switch around, and the Brewers bats go quiet for another month, and the pitching staff is unable to continually walk the line of exceptional run prevention, it’s quite easy to see an extended cold stretch emerging (recall that this is the offense that was Twenty Three runs below average after their first 37 games; so, these last 17 games have been cathartic if uncharacteristic, and those underlying traits remain). Yet even a 24-30 record in one-run games would be rather mundane, if potentially devastating to playoff odds.
| 2018 Brewers | Wins | Underlying Statistic Result |
|---|---|---|
| One Deviation | 92 | -6 RS / +95 RA |
| Average | 80 | -11 RS / +13 RA |
| One Deviation | 68 | -82 RS / -48 RA |
At the same time, a 92-win 2018 Brewers team seems downright reasonable given that the Milwaukee Nine are systematically yielding ground balls into an excellent defense, and now the bats are coming around to boot. In fact, this was one particular scenario I outlined while discussing Runs Prevented rankings approximately 10 days ago. In fact, a 92-win season would be close to the club’s Pythagorean pace entering Sunday, and that pace following Sunday’s win. The club features a legitimately exceptional bullpen even after one accounts for potential regression from some of the top percentile performances. What is difficult to discern is that the elements are the same as the 68-win Brewers, it’s simply that their distribution is different. So, as expected in many cases, the 2018 Brewers will continue to be a team that lives and dies by the margins of the roster; this is a team without aces, and arguably even a team without a club-defining offensive superstar, but one that succeeds because the depth of those characteristics exhibit quality across each and every roster spot (which has included 19 position players and 22 pitchers already, among the highest totals in the NL).
Unlike last year, the Daily Pythagorean exercise offers significantly more doubt for the potential futures of the Brewers. Last year, the Brewers were about as “true” as one could like a team to be, and they steadily played out their course. This year, the Brewers are rocketing to a thrilling start, albeit one with substantially more variance underlying their course. The players are familiar, the roles are set, but the outcome hangs in the balance: the next question remains whether Milwaukee can simply continue to out play their run differential and render this whole debate moot, and the last question is whether GM David Stearns will make midseason acquisitions that strengthen the club.


Can I ask why you call baseball team a “nine”? 25 guys these days of course, and in the AL they start 10 each game.
I used to see you say “Milwaukee Nine” a lot, and have noticed many younger Brewers writers do the same in recent years. I don’t care for that term personally. Not sure
Can I ask why you call baseball team a “nine”? 25 guys these days of course, and in the AL they start 10 each game.
I used to see you say “Milwaukee Nine” a lot, and have noticed many younger Brewers writers do the same in recent years. I don’t care for that term personally. Not sure if you’re going for a “Casey at the Bat” reference, but I think any association with the Mudville Nine is a bad idea…
It’s just an old baseball writing thing that I like.
There is no joy in Mudville for me when I see someone use the term “Nine”.
A great piece. I believe you are missing one significant aspect of the Brewer’s beating run differential expectations. Because their wins over expected is significantly positively impacted by the bullpen, the team can choose which games in which to have greater run prevention in games where they have a greater chance of winning. I would call it the Hader affect but it includes other bullpen arms as well. Even as the bullpen may regress towards the mean, the top end of the bullpen will suffer less of a regression. Who cares if the bullpen starts giving up more runs when the team is already losing if the offense isn’t going to come back. If the Brewers can maintain their performance over the mean when they are ahead than there current wins per run differential ratio will be maintained.