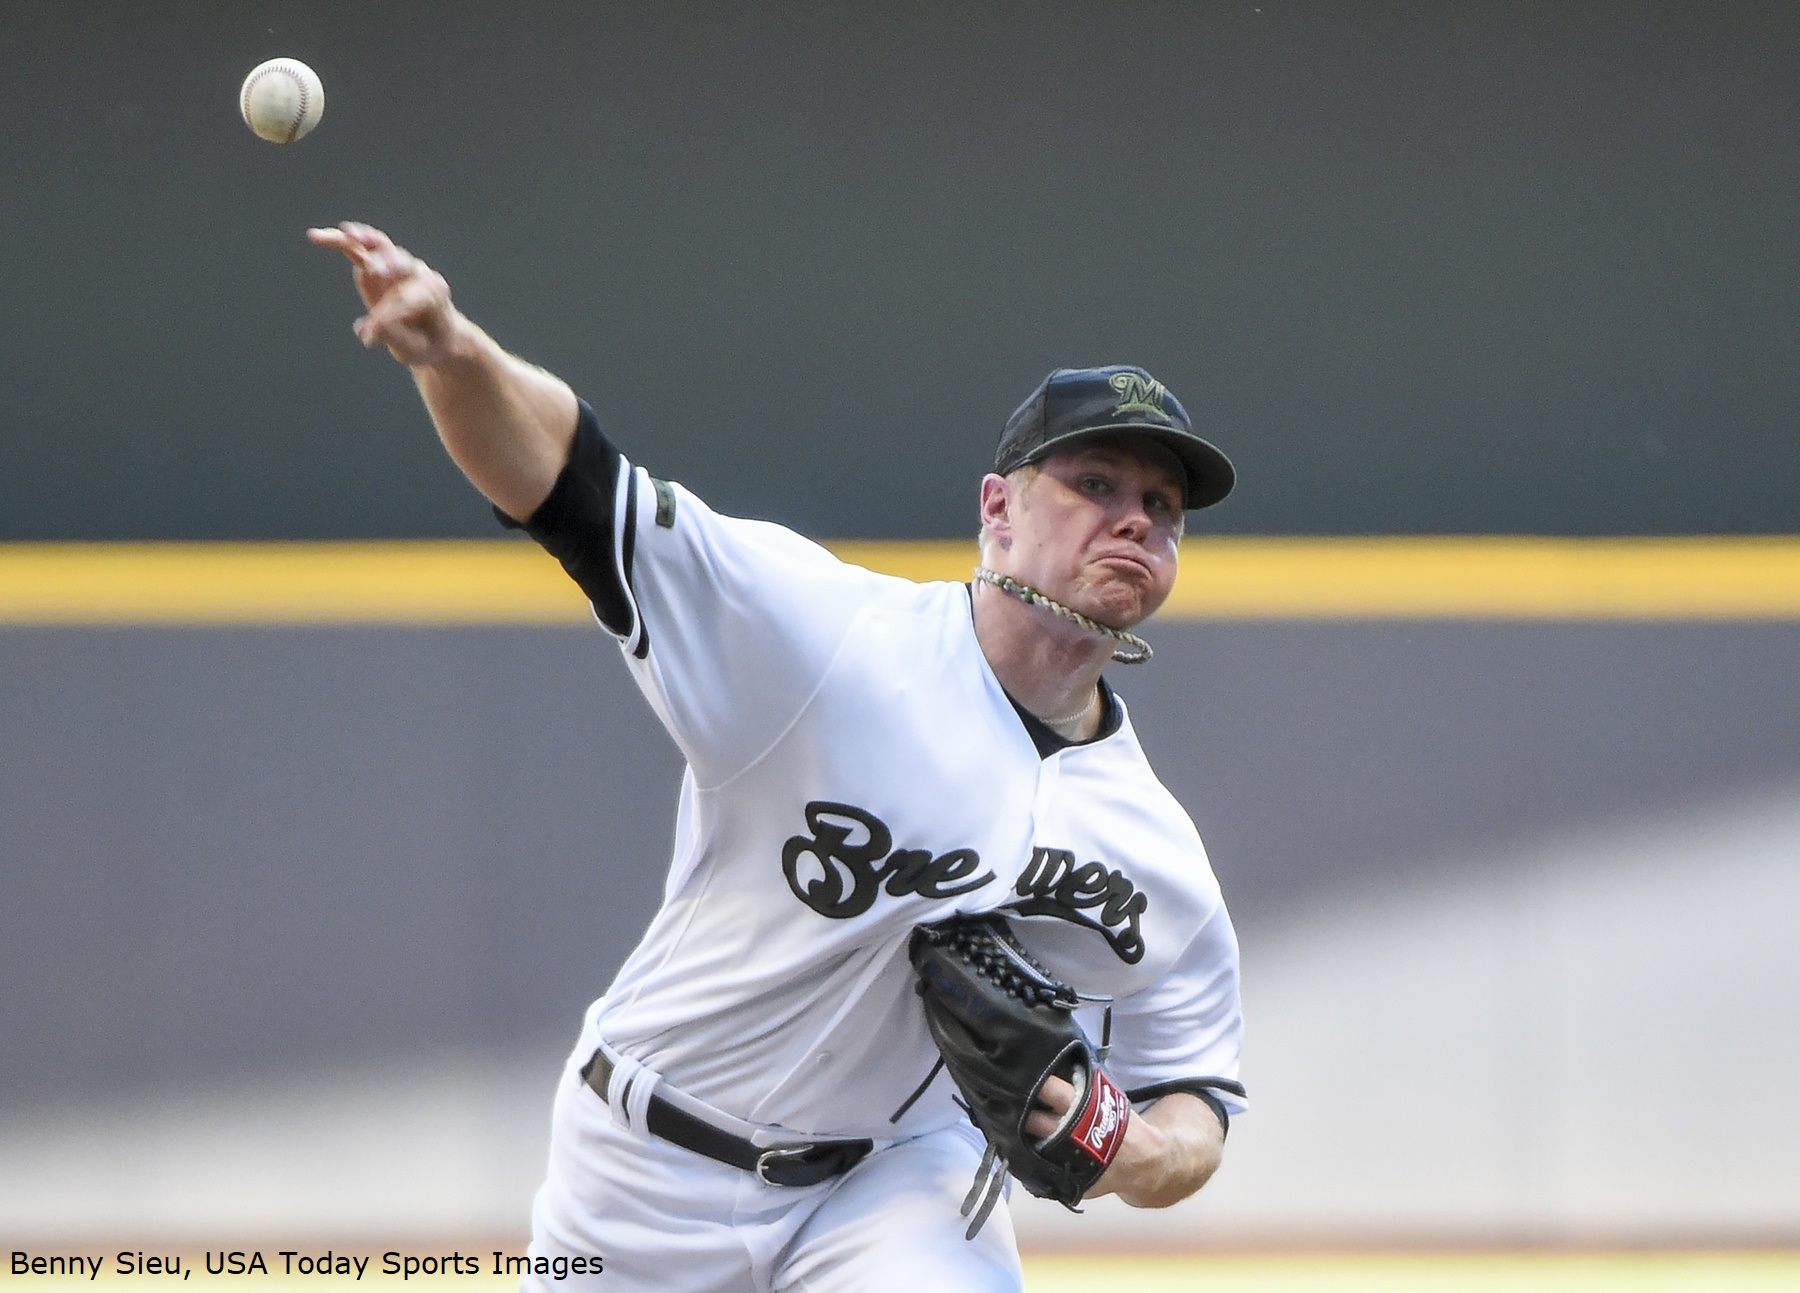
Chase Anderson’s 2018 season has been quite different from his 2017. His strikeout rate has dropped, his walk rate has risen, his ground ball rate has dropped, and his home run rate has risen. None of those trends are indicators of success, so it is no surprise that his ERA is almost two runs higher in 2018 than it was in 2017. One aspect of his performance has stayed the same, though: he is outperforming his Fielding Independent Pitching (FIP) and Deserved Run Average (DRA).
FIP and DRA both seek to improve on Earned Runs Average (ERA) and Runs Average (RA9) as a way to evaluate pitchers. The components of the two are different. For example, FIP uses the three true outcomes (strike outs, walks, and home runs), while DRA’s formula is more complex, and FIP is scaled to ERA while DRA is scaled to RA9. Both stats attempt to produce an ERA-scale number that provides a “better” approximation of a pitcher’s performance, and research over the last year addresses the descriptive and predictive outlooks of both stats. Additionally, recent Baseball Prospectus research into MLB Advanced Media demonstrates predictive characteristics of FIP and DRA compared to popular Statcast “x” metrics. FIP and DRA can be compared with their “traditional” counterparts to determine whether a pitcher has gotten lucky, or has some other ability to control the type of contact hitters are generating.
In the last twenty years, 241 starters have made at least 100 appearances. Of those 241, only 14 have posted an ERA at least ten percent lower than their FIP. As you may have guessed, Anderson is one of those fourteen pitchers. There is no particular pattern to the caliber of names on the list; they range from as successful as Kyle Hendricks (2.96 ERA) to as unsuccessful as Armando Galarraga (4.78 ERA). Anderson is right in the middle of this list, as his career 3.92 ERA ranks eighth.
There is, however, a pattern to the type of skillset that appears on this list; the highest BABIP allowed on this list is .288, which is lower than the league average has been at any point during these twenty years. I don’t think this is a huge surprise, but it does confirm an intuitive understanding of the relationship between peripherals and run prevention. Pitchers who give up fewer runs than their three true outcomes would suggest are better at minimizing hard contact.
This relates to Anderson because it tells us about the indicators of his success. There have been a multitude of factors this year; as described above, his command has deserted him and his walk and strikeout rates have inverted. His messy 4.42 ERA is, for better or worse, the main story. In 2017, his ERA was 2.74, and the Brewers were counting on him to replicate at least most of that performance. He has been unable to do that.
Weirdly, Anderson’s BABIP this season is the lowest of his career (.219). Given the ballooning ERA and poor walk and strikeout rates, I would have expected him to be getting hit particularly hard. That does not seem to be the case, however, and what we should take from that is uncertain. On the one hand, his low BABIP seems to be driving his ability to outperform his FIP/DRA, which is a positive given that that ability is a calling card of his success. On the other hand, it may be the only reason his performance has been somewhat respectable, and any type of BABIP regression could see his season balloon out of control.
Going forward, this gives us another aspect of Anderson’s performance to focus on. His walk and strikeout rates will get the headlines because they are the most obvious and most visible, but his BABIP is interesting as well. He is a FIP- and DRA-beater, but he does that despite not having ridiculously low BABIPs (career .285). If the low BABIP in 2018 is covering his inability to outpitch his peripherals, then any type of regression in his batted ball luck could be disastrous. We will just have to wait and see.
Photo Credit: Benny Sieu, USA Today Sports Images
