Ticket pricing isn’t a very sexy topic; it’s one that isn’t readily discussed by the media or even in sabermetric circles, but it remains vitally important. Like so many parts of baseball, ticket pricing is getting smarter. We so often, as fans of the game, prefer to forget that baseball is a business and that the owners and shareholders demand profits. Ticket sales, obviously, drive a portion of that. But when a fan buys a baseball ticket, he or she is often times rarely buys just a ticket, but also a parking ticket, food, and perhaps memorabilia. An afternoon of baseball can quickly become an expensive experience.
That’s why ticket pricing has more than one purpose. It can most importantly be a way to attract fans to the games, often creating new fans (or, perhaps, repeat customers) in the process. Whether it’s by giving away free tickets, creating special promotional nights, such as the ever-popular bobblehead nights, or packaging together family plans to attract younger baseball fans, plenty of ways exist to control and maximize the fan experience with ticket pricing.
Alex Remington pointed out in a recent Hardball Times article, “Young people don’t buy tickets.” Thus, what better way to attract the younger generation than to create affordable prices for parents to bring their kids to the games? These are merely some of the many reasons why baseball is getting smarter in ticket pricing.
One of the main strategies in ticket pricing has been variable pricing, first embraced and utilized by the San Diego Padres. This is how it works: “[T]eams set different prices for the same ballpark seat, depending on the day and the time of the game and the popularity of the opponent.” Wendy Thurm points out in this article, “The Nuts And Bolts Of Variable and Dynamic Pricing,” that the goal for San Diego was to “drive demand for certain games with low prices and maximize ticket revenue for high-demand games with high ticket prices.” So, for example, a Brewers-versus-Cubs game would be significantly more expensive than a Brewers-versus-Reds game.
While variable pricing augmented profitability, there were still advantages one could gain from other ticket pricing strategies, such as dynamic pricing. Dynamic pricing was first used by the San Francisco Giants in 2009 and is a pricing strategy that employs algorithms “to measure demand and price sensitivity to a particular game on a real-time basis. Many factors are considered, including the weather, a winning or hitting streak, the debut of a hot prospect and the price tickets are selling for on the secondary market, like StubHub”. The strategy proved to be a huge success for the Giants, and according to Wendy Thurm’s article, by the 2012 season 17 out of 30 MLB teams adopted the concept, including the Milwaukee Brewers.
The problem when trying to look at ticket pricing, though, is that data is traditionally thought to be shielded from public availability. Fortunately, TiqIQ is a website that provides basic ticket pricing data on the Brewers and other major-league teams dating back to 2010. When first looking at the Brewers’ data, something interesting becomes readily apparent.
| Year | Prices |
|---|---|
| 2010 | $36 |
| 2011 | $40 |
| 2012 | $32 |
| 2013 | $39 |
| 2014 | $55.24 |
The average ticket price being sold spikes dramatically between 2013 and 2014. One explanation of this could stem from the algorithm the organization used for dynamic pricing. Remember that one of the factors is a hot streak, and from April through July of last season, the Brewers were on a significant and extended hot streak. This could have easily lead to the sudden rise in ticket prices at Miller Park.
But was this price increase merely an anomaly or does this spike in ticket prices regularly occur across the broader baseball landscape? As our own Matthew Trueblood once said, “Context is King”. To answer this question, I calculated the percentage change for every team for every year between 2011-2014. (Apart from the Nationals, that is. I am unsure why TiqIQ does not supply ticket sales data on the Nationals. Similarly, the data from the Diamondbacks only stretched back to 2011.) Since the change is the percentage from one year to the next, I would have needed the 2009 ticket sales data to calculate the percentage change for 2010. Thus, below is a table of the top-ten percentage changes since the 2011 season.
| Num | Team | Year | % Change 2011-2014 |
|---|---|---|---|
| 1 | Angels | 2011 | 76.16% |
| 2 | Yankees | 2013 | 64.07% |
| 3 | Giants | 2013 | 56.11% |
| 4 | Mets | 2012 | 46.71% |
| 5 | Royals | 2013 | 45.35% |
| 6 | Brewers | 2014 | 41.64% |
| 7 | Red Sox | 2013 | 39.60% |
| 8 | White Sox | 2014 | 39.14% |
| 9 | Marlins | 2014 | 38.78% |
| 10 | Cardinals | 2013 | 37.92% |
As you can see, the Brewers’ 2014 season ranks sixth since 2011. What’s even more interesting, though, is that since 2011, the Brewers ticket price increase has been the third-highest in the majors. Below is a graph of the average percentage change in ticket prices since 2011.
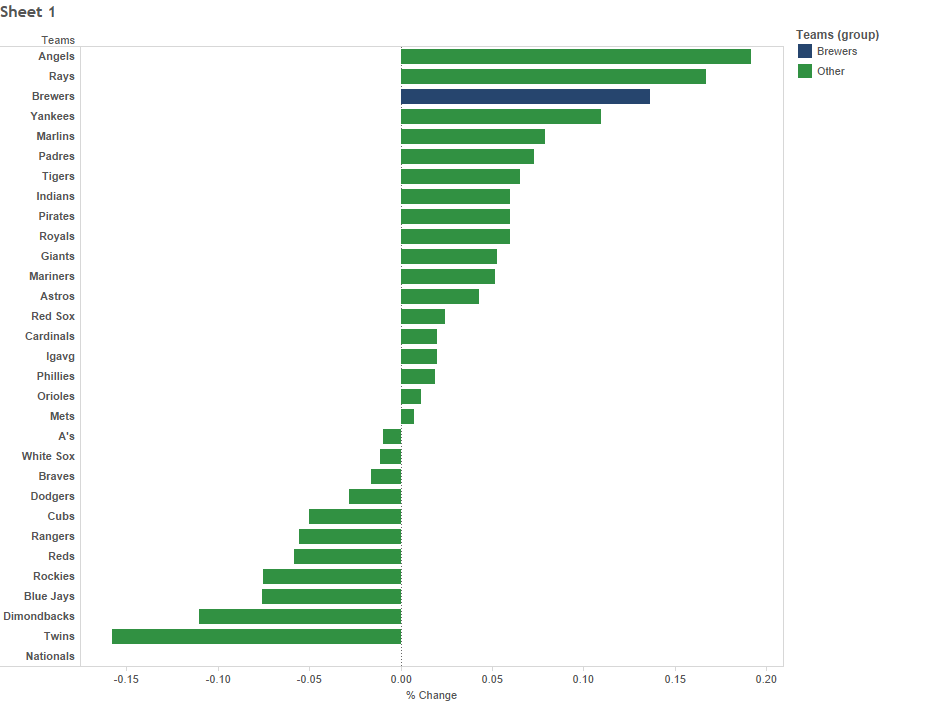
The Brewers rank only behind the Angels and Rays in percentage-change increase since 2011. As mentioned before, ticket pricing is important. It doesn’t only have an impact on a club’s profit, but it also weighs on the fans. The Angels definitely illustrate that point this year. They’ve seen a drastic drop in attendance thus far, which seems to be caused by a new ticket pricing strategy. The club has said, “We’re taking a different strategy this year. We’re getting a higher yield per ticket, selling less tickets, making a little bit more money than we did last year.” (Per Pedro Moura’s article).
Though the ethical implications for such a strategy are clear, the increased ticket prices have not affected the Brewers’ attendance, but perhaps this is because the Brewers started from such a low price. (For reference, check out this Craig Edwards article, Attendance Update and the Angels’ Latest PR Mess.) While the Brewers did see a big jump in ticket pricing in 2014, and have one of the biggest increases in ticket prices since 2011, they’re still one of the teams that provide some of the cheapest tickets in baseball, on average.
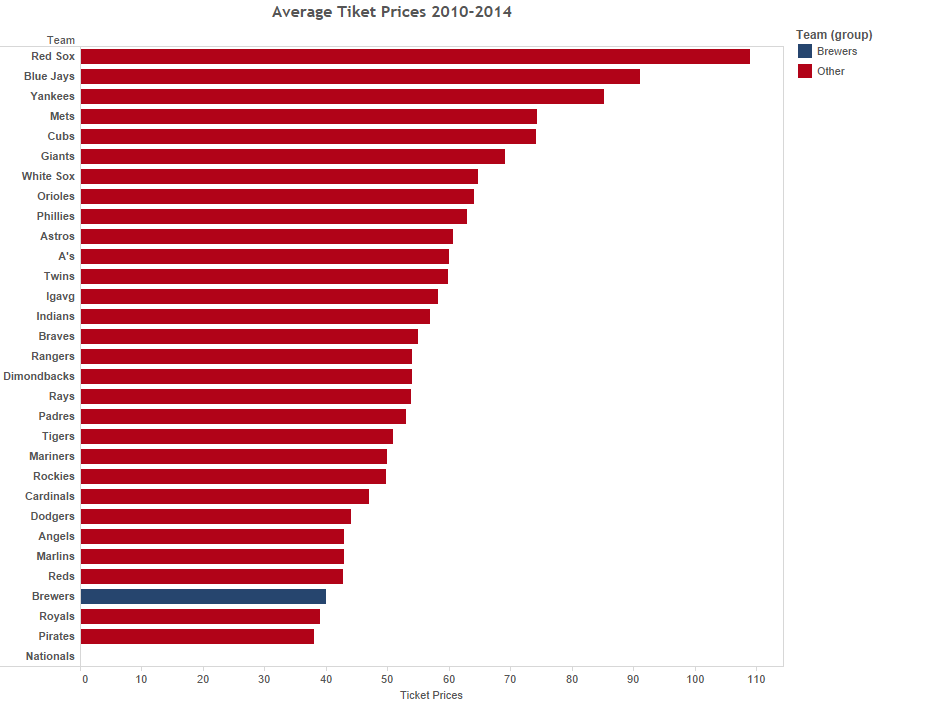
Thus, while no one likes to see a big ticket-price increase, the Brewers’ prices seem rather reasonable. Even if one considers that the team hasn’t made the playoffs since 2011, the average ticket prices remain comparatively inexpensive, especially when compared to other markets. Look at Boston, for example. They have finished with the worst record in their division two of the last three years, yet their tickets (on average) cost more than $100. Brewers’ tickets cost $40. Granted, we lack the data for the concession stands expenses and or parking tickets (perhaps future studies should include cost-of-living analysis, as well), but as far as the average ticket price for a Brewers game is concerned, it seems reasonable on the surface.
BONUS:
In my research for ticket price data, I stumbled upon SABR Business of Baseball Committee, which is a website created by Doug Pappas. I found additional ticket price data on the Brewers. The problem is that the data is incomplete. The data went from 1969 to 1985 and then again from 1991 to 2004. Since the data was so fragmented, I opted to not include it in my analysis. For those interested, though, here is how ticket price data of the Brewers trended over those years:
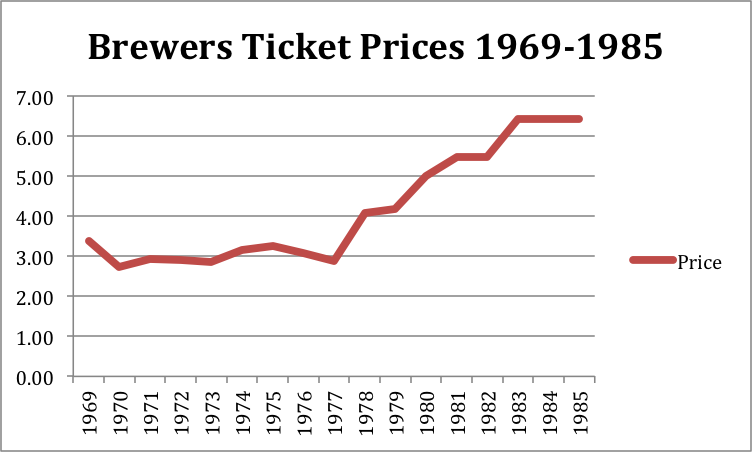
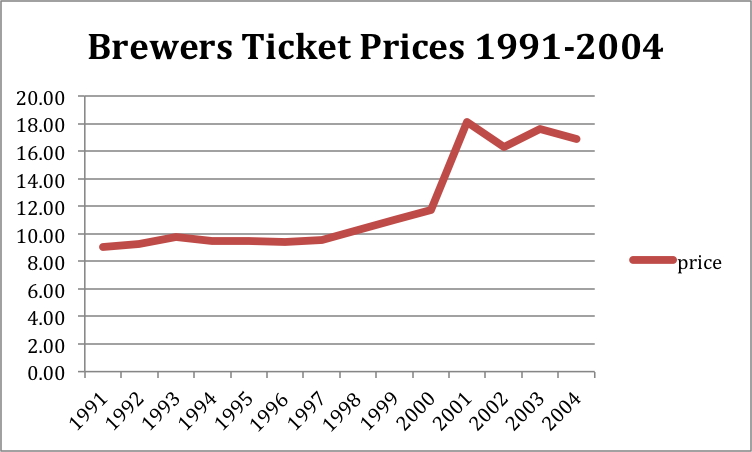
One can easily see the massive jump in ticket prices from 2000 ($11.72) to 2001 ($18.12). The percentage change for that year was 54.6 percent, which is the biggest increase in percentage change for historical Brewers ticket prices that I was able to find. The explanation for the drastic change is rather obvious. That was the year the Brewers moved from County Stadium to Miller Park.
Very interesting. I am in Minneapolis and held season tickets for the last six years (last year of the dome and then all of the Target Field years.) Twins have not raised season ticket prices once, and have actually decreased the average price by over 15%, thanks to four 90-loss seasons in a row. Yet they still remain top 12 in highest price. What a shame they couldn’t put a winning product on the field. The $10 drop in average ticket price from ~$70 to ~$60 over the past four years equates to about $25-$30M a year in gate revenue – coincidentally, that is the same value of a marquis player or two very good ones.
Thanks for the comment Paul. I would also not expect the Twins tickets to any cheaper in 2015. They also use dynamic pricing (per Wendy Thurm’s article) and considering there early season hot streak, and the promotion of top prospect Byron Buxton, I would expect the average price for tickets at Target Field to increase in 2015.
A little part of me is in total disbelief while simultaneously not being surprised that Toronto is second in average ticket price… Have to be close to last in fan experience. Woeful food and beer selection.
Great article.
Thanks! That’s too bad though about Toronto, not having a good fan experience, was really looking forward to attending Blue Jays games when I move to Toronto.