Within the last three months, there have been five articles written about Jean Segura. This will be the sixth. It is funny that one player should draw interest from multiple writers from the same site, but it is fitting for a player like Segura. As my colleagues have pointed out, the overarching theme with Segura is that he is a player with a ton of potential that has gone unrealized. J.P. Breen convinced readers to manage their expectations of the young shortstop. Meanwhile, Ryan Romano discussed the value of Segura’s glove back in August and looked at Segura’s significant dip in power, briefly touching on the league’s adjustment to his hitting tendencies.
It has been noted that pitchers adjusted to him as early as the second half of 2013; however, there has been little discussion about the success and failure of his own adjustments. Now that he has logged three full seasons at the plate, this article will take a deeper look at Segura’s adjustments at the plate in relation to the approach pitchers have taken against him.
The 2013 season was Segura’s best offensive season. In 588 at-bats, Segura triple slashed .294/.329/.423 and posted the highest TAv of his career, .265. During that season, pitchers were pitching in the lower half of the strike zone, significantly pounding the zone low and away.
In fact, according to Baseball Savant, pitchers threw in the lower-left quadrant (catcher’s POV) 27.317 percent of the time. For right-handed batters, that tends to be where they are most vulnerable, which is why some manager’s are eager to play the righty-versus-lefty matchups. However, overall in 2013, this was not the case for Segura.
| Pitch Outcome (Zone 9 & 14) | Total |
|---|---|
| Ball | 48.5% |
| Called Strike | 12.4% |
| Whiffs | 10.0% |
| Fouls | 11.1% |
With pitches that landed in the lower-left quadrant, Segura took almost 50 percent for a ball. Cumulatively, 33.5 percent were a strike of some sort.
Not surprisingly, in 2014, pitchers continued to throw low-and-away to Segura; though, he would post the worst batting average of his career. Segura triple-slashed .246/.289/.326 and saw his TAv drop to .235 — a full thirty points below from the previous season. Looking at his batted-ball profile, it’s clear that there was a massive decrease in power. In fact, his ISO went from .129 in 2013 to .080 in 2014, affirmed by the increase in softly hit balls (16.7 percent in 2013 to 25.6 percent in 2014) and the simultaneous decrease in hard hit balls (28.9 percent in 2013 to 21.1 percent in 2014). However, simply looking at the numbers does not really explain why there was a decrease in power.
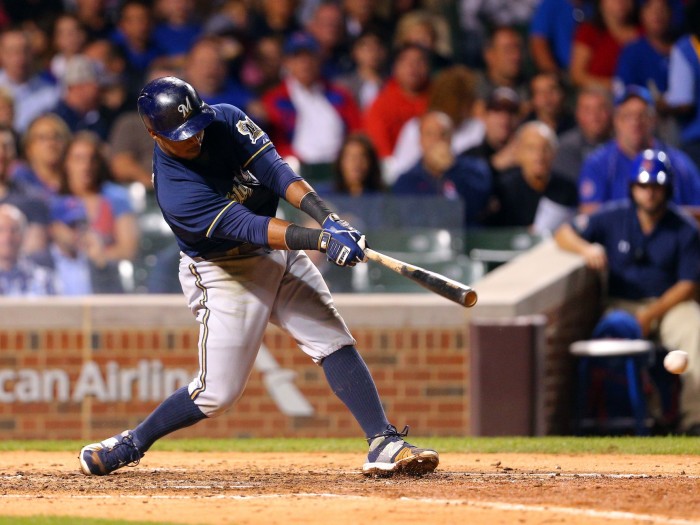
I took a cursory glance at Segura’s batting stance between the two seasons and noticed a significant difference. To limit the variables, I only looked at pitches that were only in the lower-left quadrant of the strikezone, roughly the same velocity and pitch, and resulted in a groundout.
Here is his stance and swing in 2013:
And here is his stance and swing in 2014:
There is a clear difference between the two at-bats. In 2013, Segura is in a semi-squat with his weight resting on the balls of his feet. Whereas in 2014, Segura is standing almost upright and it seems that his weight is resting on his back leg. Looking closer, there is also a difference in how he holds the bat. In the first still, Segura has the bat at an angle, almost resting on his shoulder. In the second frame, he is holding the bat vertically. Due to his compact stance in 2013, Segura was able to square up pitches that broke low and away with greater ease. Contrasted against his stance in 2014, we can see that he was forced to meet the ball lower in the strikezone towards the end of his swing. What were the results of the two at-bats? The result of the first frame was a sharply hit groundball to the opposing shortstop. The result of the at-bat in the second frame was a weakly hit chopper back to the mound.
Segura did make adjustments to his swing late in the season, and it paid off in the final month of the 2014 campaign.
| Month (2014) | Soft | Med | Hard |
|---|---|---|---|
| June | 22.8% | 54.4% | 22.8% |
| July | 31.3% | 53.7% | 14.9% |
| August | 32.1% | 44.6% | 23.2% |
| Sept/Oct | 20.0% | 56.7% | 23.3% |
While this may indicate that this examination of 2014 is not conclusive, it does shed some light as to why most of 2014 was disastrous for Segura.
Finally, we turn to this past season. In 2015, Segura posted numbers that were almost identical to 2014. He ended the season with a triple-slash line of .257/.281/.336 and an even lower TAv of .218. It appears that pitchers adjusted to Segura’s swinging tendencies as they had pitched to him in the strikezone’s lower-left quadrant 31.113 percent of the time. That is a huge increase from both 2013 (~27%) and 2014 (~25%). Unfortunately, there was an increase in swing rate and a simultaneous decrease in contact rate for pitches outside of the zone.
| Year | O-Swg Rate | O-Contact Rate |
|---|---|---|
| 2013 | 34.06% | 74.75% |
| 2014 | 34.38% | 72.56% |
| 2015 | 38.52% | 70.57% |
Further compounding this issue was the fact that of the pitches in the lower-left quadrant that resulted in a ball in play, only 21.2 percent were a hit while the remaining 78.8 percent resulted in an out. Interestingly, in 2015, the National League average for pitches thrown outside the strikezone was 55.2 percent. Meanwhile, Segura received 51.15 percent of pitches in the zone. Pitchers were four percent more likely than average to throw to Segura in the zone. There was a noticeable drop in his walk rate this season that resulted from poor plate discipline; however, that does not account for the entirety of his lukewarm 2015 season. I’m curious to see what further research may discover.
If Jean Segura is around by the time the 2016 season starts, there are a few changes I hope he makes. The first change that will benefit him is a more consistent swing. Pitchers, when facing Segura, will continue to pound the zone low and away because it is effective. If he is able to find a stance and swing that will allow him to square up against pitches on the outside corner, he may be able to add a little more zip to the ball off the bat. It may force pitchers to change their attack. Second, regardless of what pitchers decide to do against him, Segura must improve his plate discipline. That is especially true if pitchers are offering less outside of the zone to Segura than they are to the rest of the league. His walk rate has never been something to admire, especially when compared to the league average. However, his shocking 2.2 percent walk rate in 2015 is downright unacceptable considering the league-average walk rate this year was almost four times as high.
If any changes are made to his mechanics and his approach at the plate, it is unlikely we will see the Jean Segura from the first half of 2013 if there is an improvement. However, any improvement from the last two years — even if it does not measure up to his first full season — would be a step in the right direction.