Most of the time in baseball analysis, we’ll look at a player’s full-season statistics only. While this generally covers the full breadth of their production, it can sometimes obscure more pertinent details. For instance, Adam Lind (RIP) hit very well overall last season, but his ability petered off toward the end of the season. With that said, it’s important to not mistake a fluke for a trend. When delving into intra-season splits, we should weigh them against the overall results and generally exercise some caution.
Let’s look at two different sets of offensive statistics:
| AVG | OBP | SLG | wOBA | wRC+ |
|---|---|---|---|---|
| .089 | .196 | .089 | .150 | -16 |
| .214 | .321 | .471 | .341 | 116 |
Both lines belong to new Brewers first baseman Chris Carter. He posted the first line over his first 13 games in 2015, and the second over his final 116 contests. After a tremendous slump, he rebounded to his career level of play — he owned a 114 lifetime wRC+ before the season began — for the rest of the year.
Houston non-tendered Carter in no small part because of his poor all-around 2015. Before then, he had averaged +1.4 WARP per 600 plate appearances, which fell to just +0.5 WARP last season. His offense played the largest role in his vanishing value: Compared to that 114 career mark, a 101 wRC+ (his overall figure for 2015) just won’t suffice. He certainly seemed to have become a worse hitter as a whole, which allowed Milwaukee to scoop him up on the cheap.
Given this breakdown, though, we might expect him to return to usefulness in 2015. After all, he looked just like himself once he snapped out of his funk. If those hideous 13 games hadn’t happened, he’d have enjoyed a prosperous 2015, on par with the fairly fruitful campaigns that preceded it. There’s nothing to worry about, right?
Here’s the thing about Carter: He goes on streaks, in both directions. Sometimes, his bat will heat up; sometimes, it will cool to an unbelievable level. This has always defined him, even before 2015 — check out his career wOBA*, on a per-13 game rolling average:
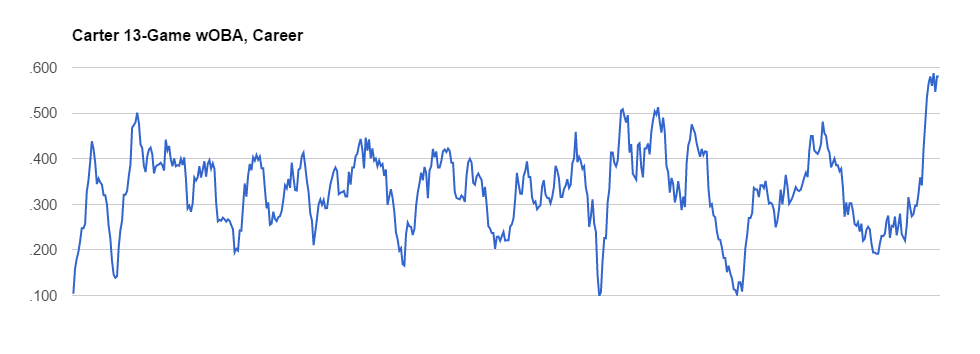
*This uses the general wOBA formula, meaning the result may differ from his actual wOBA by an insignificant amount.
Note that Carter’s 13-game slump in 2015 (the last major valley of the graph) wasn’t his worst, by a wide margin. In fact, he’s had 15 stretches of at least 13 games with a sub-.150 wOBA — meaning that, when he stumbled out of the gate a year ago, he didn’t do so without precedent.
Why, then, did Carter disappoint last season? Simple: He didn’t have enough good to make up for the bad. From 2010 to 2014, he played in 399 games, giving a 387-game sample for rolling averages. Of those 13-outing streaks, 195 — or 50.4 percent — featured a wOBA over .350. In 2015, he compiled 117 such stretches (on the back of 129 games); 36 of those had a wOBA above .350, translating to a 30.7 percent clip. Whereas Carter had once excelled in half of his two-week stints, he did so in less than a third come 2015.
The .350 used is an arbitrary number, clearly. No matter what cutoff we use, however, the same conclusion emerges:
| Threshold (wOBA) | 2010-2014 | 2015 |
|---|---|---|
| .330 | 57.6% | 42.7% |
| .340 | 54.0% | 35.0% |
| .360 | 45.2% | 28.2% |
| .370 | 40.8% | 25.6% |
Carter has dealt with hardships like this in the past — he’s just managed to make up for them by dominating for extended periods, something that he didn’t accomplish often enough in 2015. His feast-or-famine approach betrayed him, and his overall numbers suffered as a result.
With inconsistent hitters in this mold, we shouldn’t remove the lows from the equation. Did Carter hit as well as ever following his 13-game slump at the beginning of 2015? Yes, but that down period still happened, and we can’t ignore it. Maybe he’ll sustain a hot streak for a full season in 2016; maybe he’ll keep up a cold one. Whatever occurs, we mustn’t read too deeply into it.
1 comment on “Chris Carter and the Problem with Inconsistent Hitters”