Because they don’t plan on competing this season, the Brewers have taken chances on a few high-risk, high-upside players. Chris Carter, who came to Milwaukee after Houston non-tendered him, fits this mold. He could flame out, striking out too often to compensate for the occasional home run, or he could bombard the opposition with long balls and reward the Brewers’ gamble. Based on the available projections, we could credibly predict either of these outcomes.
When I don’t write about Brewers baseball at BP Milwaukee, I cover all things baseball at Beyond the Box Score, SB Nation’s sabermetrics site. One of my recurring series there has been Mediating Projections, where I look at disagreements between Steamer and ZiPS — FanGraphs’ two projections. (Click here for the latest installment of that series, starring Justin Turner of the Dodgers.) When poring over the forecasts for Milwaukee hitters, I noticed that Steamer was quite pessimistic toward Carter, whereas ZiPS expressed more optimism:
| System | PA | K% | BB% | ISO | BABIP | AVG | OBP | SLG | wOBA | wRC+ |
|---|---|---|---|---|---|---|---|---|---|---|
| Steamer | 404 | 32.2% | 11.5% | .233 | .278 | .222 | .317 | .456 | .333 | 107 |
| ZiPS | 505 | 30.5% | 11.9% | .269 | .282 | .237 | .333 | .506 | .358 | 126 |
Carter has a wide range of possible outcomes for 2016, and Steamer and ZiPS cover the breadth of them pretty handily. According to these systems, he could hit as well as 26 percent better than average, or as poorly as seven percent better than average. For the sake of comparison: Ryan Braun posted a 129 wRC+ in 2015, and Domingo Santana notched a 109 wRC+. The gap between those two is pretty significant, which should drive home the magnitude of the Steamer-ZiPS disparity. (It should be noted, though, that Braun’s .298 TAv and Santana’s .299 TAv complicate this notion a bit.)
How will Carter’s batting line look come season’s end? Let’s dive into the four areas of offense listed above — strikeouts, walks, isolated power, and batting average on balls in play — to see which projection has a better chance of coming true.
Strikeouts
These are, and always will be, Carter’s calling card. During his three years as a regular in Houston, he went down on strikes 33.7 percent of the time, more often than any other qualified player in baseball. He’ll produce for Milwaukee only if he can get this under control, as ZiPS thinks he can. If he fails to do that, which Steamer foresees, he won’t have much in terms of offense. What should we expect?
First of all, we should note that regression to the mean will probably have some effect here. In all likelihood, an event as extreme as Carter’s strikeout rate will become more normal in a larger sample. So right off the bat (no pun intended), we get some evidence in ZiPS’s favor.
Second of all, and more importantly, Carter has done worse than his background statistics suggested in recent years. Using the formula from my post on Adam Lind in October, we get an expected strikeout rate of 31.5 percent from 2013 to 2015, 2.2 percentage points below the aforementioned mark. In 2015 specifically — the sample in which I analyzed Lind — Carter had a strikeout rate of 32.8 percent and an expected strikeout rate of 30.5 percent, about the same level of difference.
Of course, if Carter has underperformed in the past, maybe he’ll keep it up in the future. As we did with Lind, we should look at his rates of looking and swinging strikes by count, to see if he has the peripherals to back this up:
| Count | Whiff% | Whiff%+ | Look% | Look%+ |
|---|---|---|---|---|
| 0 Strikes | 13.7% | 238 | 26.2% | 86 |
| 1 Strike | 19.5% | 195 | 12.2% | 103 |
| 2 Strikes | 19.6% | 159 | 6.5% | 148 |
In two-strike counts, Carter has fared much worse than average, by both called and swinging strikes. This would seem to support Carter’s high strikeout rate — although he doesn’t appear to have deserved it, a closer look reveals its legitimacy.
Still, it’s hard for pitchers to fan anyone that often. While Carter will certainly strike out a lot in 2016, I think his clip of those will fall in line with what ZiPS projects. Even given the lack of peripheral strength, a lower strikeout rate will probably be in the cards.
Walks
Like many high-strikeout players, though, Carter takes free passes now and then. He earned an unintentional walk in 10.9 percent of his plate appearances as an Astro. Both Steamer and ZiPS see him improving upon that level of play, but to different extents. Can he pump up his on-base percentage to negate those punchouts?
It’s important to note Carter’s three distinct Houston campaigns. During the middle one, he walked far less often than he did in the two sandwiching it, and we can easily see why:
| Year | Zone% | O-Swing% | uBB% |
|---|---|---|---|
| 2013 | 48.4% | 26.7% | 11.8% |
| 2014 | 48.4% | 28.5% | 8.8% |
| 2015 | 48.4% | 24.1% | 12.2% |
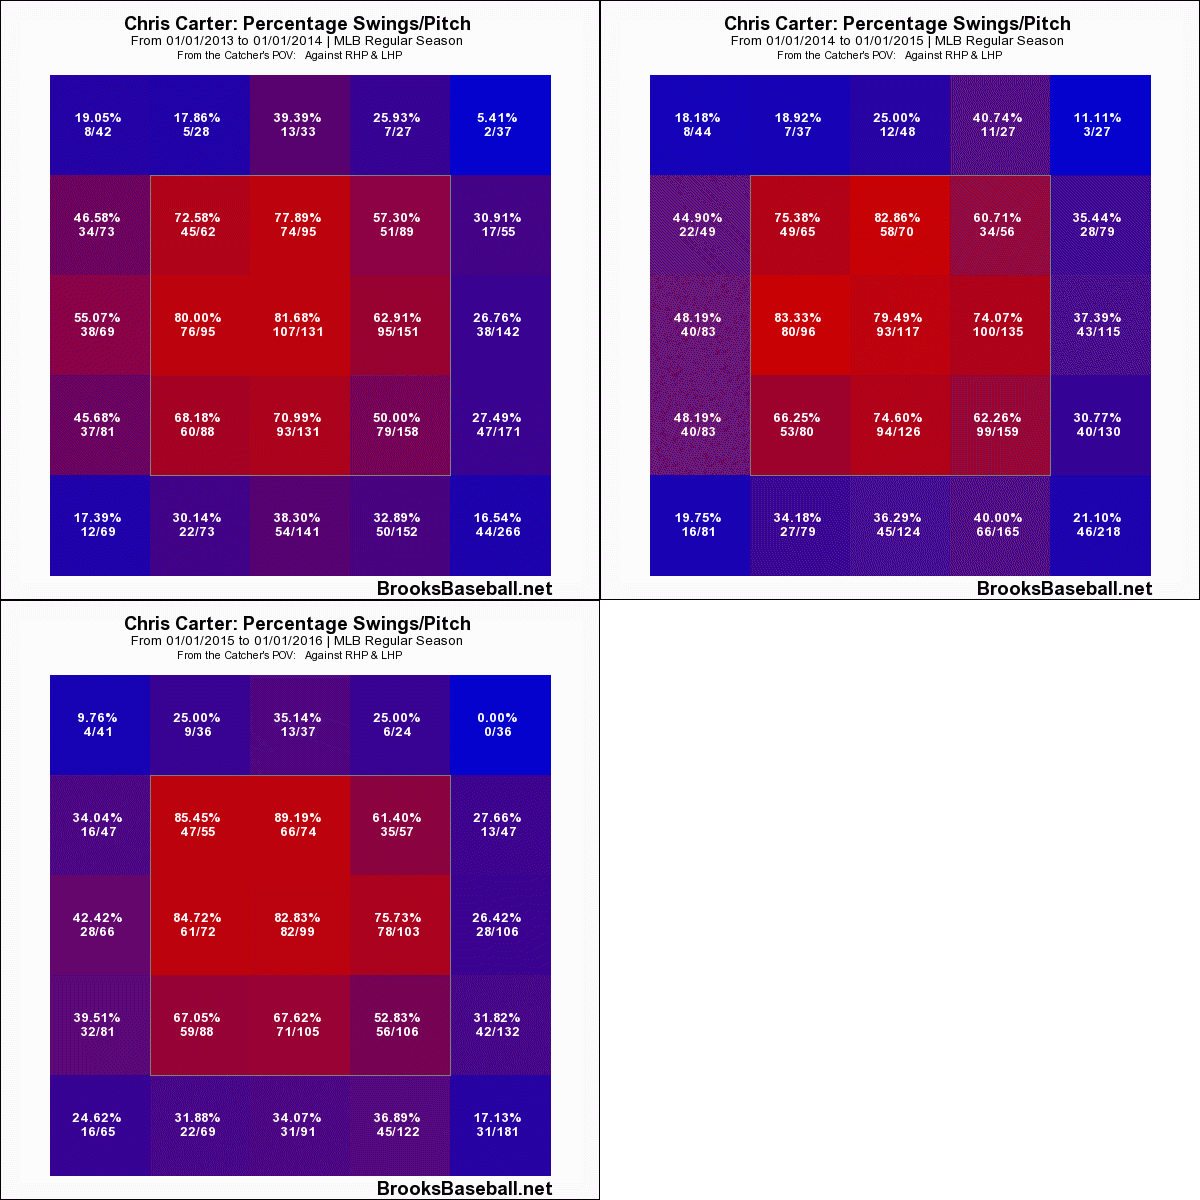
Pitchers didn’t change a thing in 2014, but Carter clearly did. His more aggressive approach meant he chased more often, which brought him fewer bases on balls. A glance at his zone plot shows where those extra swings occurred:
The 2013 iteration of Carter swung at 22.1 percent of pitches on the outer fifth of the plate. He spiked that to 28.1 percent in 2014, before bringing it back down to a more reasonable 22.7 percent in 2015.
This increase in swings wasn’t just a flukish blip on the radar. We’ll see below that Carter’s power outburst coincided with his uptick in aggression, and we can’t just ignore the results of that. If Carter returns to his unstable ways in 2016, hoping to grind out a few more dingers, he’ll see his walk rate plummet.
Even so, I think he’ll maintain his composure. The old Brewer regime — which cultivated a volatile free-swinging attitude — is no more. With it gone, Carter should have the freedom to adopt a more passive strategy, one that could help him sustain this high walk rate. Two times out of three, Carter has done what ZiPS predicts he’ll do, and I’d imagine he’ll make it three out of four.
Isolated power
Now we come to the area of the most significant disagreement between Steamer and ZiPS. Depending on whom you trust, Carter will follow up his .241 ISO for the Astros with progress or decline. Which forecast holds water?
Let’s start with the aforementioned middle year. Carter posted ISOs of .227 and .228, respectively, in 2013 and 2015. He blew those away with a .264 ISO in 2014, which the Brewers would certainly appreciate having. As noted above, however, he accomplished that only by sacrificing his plate discipline. If he continues to avoid aggression, as I think he will, the prosperity of 2014 won’t return.
Plus, even if Carter starts swinging for the fences again, we can’t guarantee that his power will return. A deeper dive into that campaign reveals the smoke and mirrors behind it. Carter didn’t hit more fly balls in 2014, nor did they travel further:
| Year | FB Distance | FB% (BP) |
|---|---|---|
| 2013 | 297.0 | 31.7% |
| 2014 | 289.2 | 31.6% |
| 2015 | 289.0 | 33.5% |
That explains why, in the second season, he severely overperformed his expected home run total. He actually hit 37 round-trippers, but based on his peripheral metrics, Baseball Heat Maps predicted he would hit 21. The resulting difference — which led the majors — isn’t the sort of thing that we should expect him to repeat.
Carter bashed a lot of home runs in 2014, which gave the baseball world a glimpse of his tantalizing potential. To regain that, he’d have to make some ugly changes, if he could do it at all. Given that ISO tends to decline once a player reaches his late 20s, we should anticipate something around the level of Steamer.
Batting average on balls in play
Carter has never notched a high average, and although strikeouts bear most of the blame for that, a subpar BABIP has made matters worse. In Houston, he garnered a hit 27.6 percent of the time he put the ball in play. Steamer envisions that level of play in Milwaukee, and ZiPS believes he’ll perform a little better. What should we think?
Carter’s BABIP has trended in the wrong direction as of late: He went from .311 in 2013 to .267 in 2014 to .244 in 2015. In theory, regression to the mean offers some hope; in practice, he probably won’t return to his previous glory. His hard-hit rates have dropped, respectively during those three seasons, from 39.5 percent to 38.3 percent to 36.7 percent, suggesting he’s earned this fall. And as a heavy fly ball hitter, he needs to make solid contact regularly for his balls to go for hits.
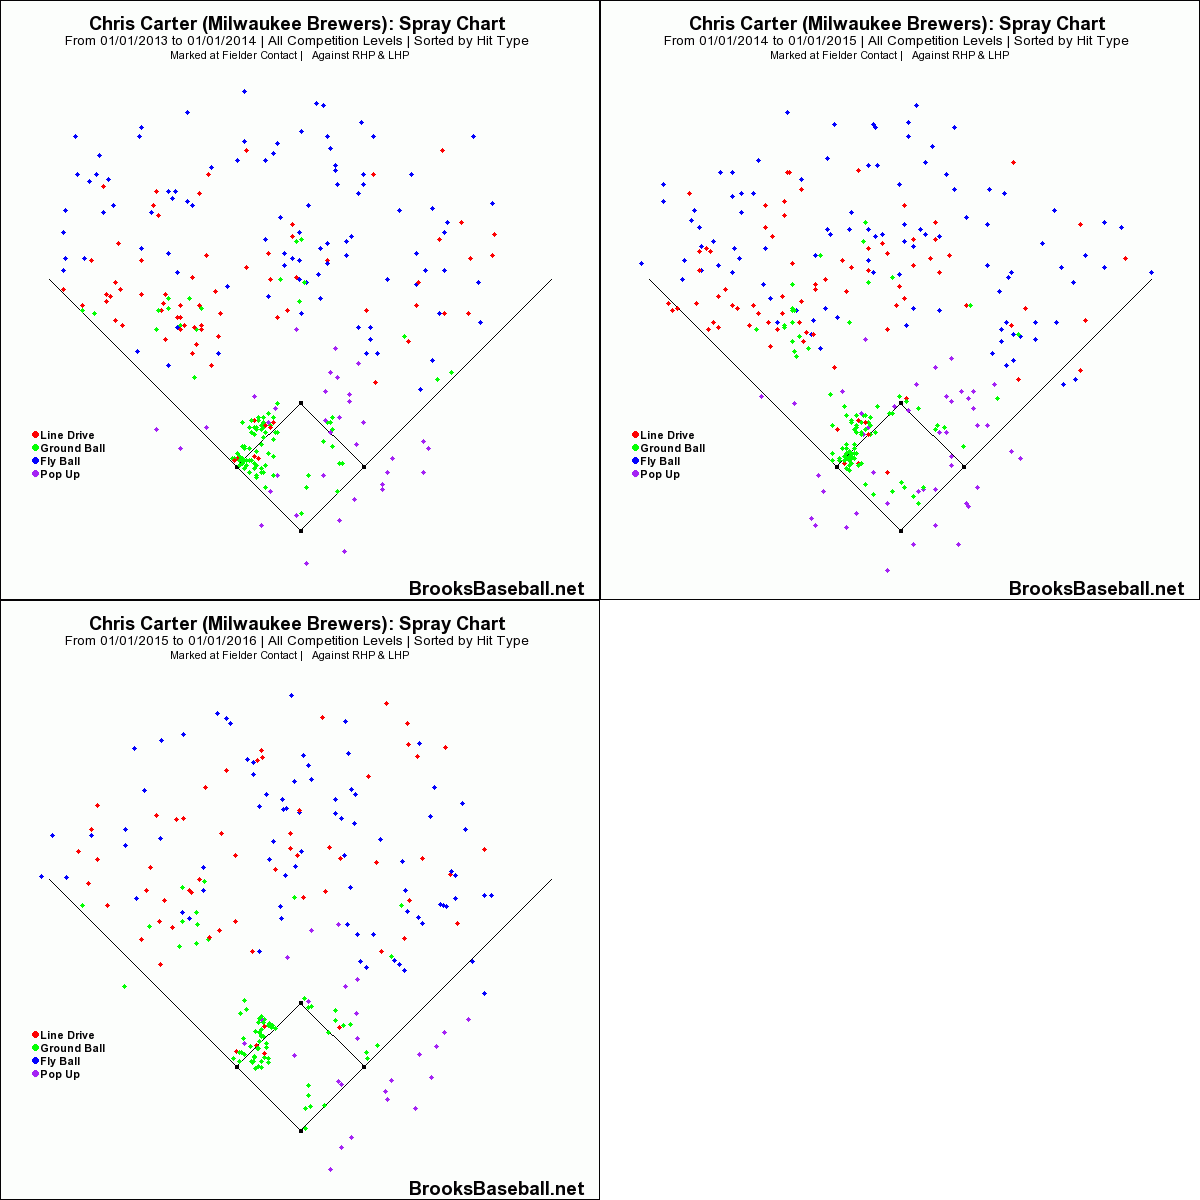
Perhaps most important is batted-ball location. Carter owns career BABIPs of .314 to left field, .298 up the middle, and .161 to right field — in other words, he succeeds when he pulls the ball. With those in mind, take a look at how he’s altered himself:
More balls to the opposite field has caused disaster. With a 39.6 percent pull rate in 2015 — more than ten percentage points below his 2013-14 level — he understandably saw his BABIP fall off a cliff. Less hard contact, and less yanked contact, equals a terrible Carter.
Balls in play are always tricky — they can go for hits constantly one year and vanish the next, all while the hitter’s skill level remains the same. Neither projection system expects Carter to stay in the .24os, and neither should we. At the same time, we definitely shouldn’t get our hopes up, because Steamer has the likelier prognostication here.
Conclusion
According to this unscientific exercise, the Brewers’ newest addition should:
- Have a (relatively) healthy strikeout rate.
- Pile up the walks
- Fall short of his power potential
- Struggle to get hits
Does this add up to an elite player, or even an average one? Not in the slightest — that’s why Milwaukee was able to pick him up. A stop-gap first baseman nevertheless has some value, which the Brewers could take advantage of at the trade deadline. If Carter does what ZiPS says, he’ll bring back a handsome reward in a deal. If he instead goes with Steamer’s prediction, well, the Brewers won’t have lost much.


