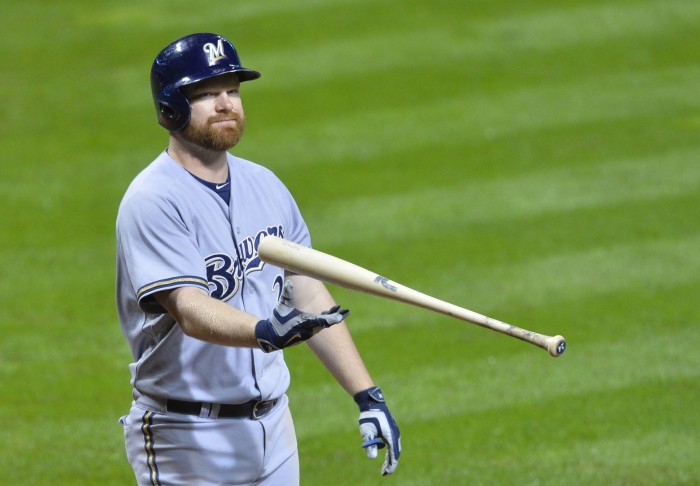
Here at BP Milwaukee, we love us some Adam Lind. He crossed the Canadian border to shore up one of the worst positions in all of baseball, and his overall hitting ability made him a rare 2015 bright spot (a late slump notwithstanding). Should the Brewers decide to trade him in the offseason, his value at first base would presumably bring a solid return. Regardless of what happens, a .294 TAv and 1.9 WARP have satiated most Milwaukee fans.
But, as a famous Disney character reminds us, the past is in the past. What Lind has done doesn’t concern us; we want to know what he will do. If the Brewers deal him, will other clubs think highly of his probable 2016 production? Alternatively, if Milwaukee holds onto him for next season, will he continue to anchor first base for a team that would like to win more than 68 games? Based on some of his background metrics, I don’t know that Lind will replicate the solid output from this year.
A large part of Adam Lind’s 2015 success came from strikeouts, or the lack thereof. He only went down on strikes in 17.5 percent of his plate appearances, a mark that falls significantly below both his career average (18.8 percent) and the 2015 MLB average (20.4 percent). Hitters with Lind’s abilities — i.e., the slow ones — need to put the ball in play as often as they can, and Lind managed to do just that this year.
With that said, his peripherals don’t support such an improvement. Lind swung at 45.2 percent of the pitches he saw in 2015, which combined with a 78.8 percent contact rate to give him a swinging-strike rate of 9.6 percent. Meanwhile, his refusal to offer at hittable pitches led to a 56.5 percent zone-swing rate; even though only 44.7 percent of his pitches fell inside the strike zone’s confines, he still had an expected looking strike rate of 19.4 percent. The latter figure handily topped the MLB average of 17.4 percent, while the former didn’t trail the 9.5 percent mean by much.
To better understand the extent of Lind’s luck, I ran a regression with those two metrics and strikeout rate, for all hitters with 1,000 pitches seen in 2015. That yielded the following equation for expected strikeout rate:
xK% = -0.165 + 1.957 * Whiff% + 0.905 * xLook%
Those 300 players break down graphically like this:
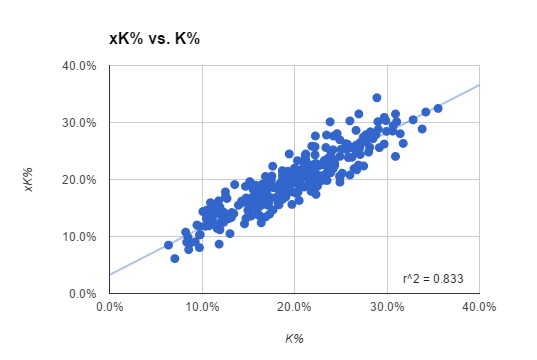
The overall list, which those interested can find here, has some notable names. We obviously care about Lind, who owned an expected strikeout rate of 19.8 percent — much higher than his actual 17.5 percent clip. The percentage-point difference between the two placed 44th in the majors, or the 85th percentile. Unlike Jonathan Lucroy, who suffered from misfortune in 2015, Lind looks to have benefited from good luck.
Of course, looking and swinging strikes alone don’t explain a hitter’s strikeout rate. Some players will consistently rack up both of the former yet manage to avoid the K. For example, Adam Jones — whose 2015 differential ranked 30th — has a history of overperformance in this area. From 2008 to 2014, he posted a strikeout rate of 19.1 percent to accompany an expected strikeout rate of 25.0 percent. Regularly beating this metric may mean that Jones has some additional skill, and his splits support that proposition.
Via research from Chris Teeter at Beyond the Box Score, we know the MLB-wide called strike and whiff rates by strike count:
| Count | Whiff% | Look% |
|---|---|---|
| 0 Strikes | 5.7% | 33.2% |
| 1 Strike | 10.0% | 26.5% |
| 2 Strikes | 12.3% | 22.3% |
Across the majors, hitters become more aggressive later in counts. The extent of this differs from player to player, though, and no one illustrates this better than Jones. For his career, he has done pretty poorly early in at-bats but has recovered later.
| Count | Whiff% | Whiff%+ | Look% | Look%+ |
|---|---|---|---|---|
| 0 Strikes | 11.5% | 202 | 25.7% | 77 |
| 1 Strike | 17.0% | 170 | 7.6% | 29 |
| 2 Strikes | 16.4% | 133 | 2.6% | 12 |
Jones does most of his whiffing and looking to start the plate appearance. Once he gets to two strikes, he protects the zone and doesn’t give in. In both regards, his discipline improves considerably while the count progresses.
On the other hand, we have hitters like Lind, who have never displayed any such capability. In the aforementioned seven-year span, Lind struck out 18.9 percent of the time (about the same as Jones), whereas he theoretically should have done so 19.0 percent of the time (far below Jones). Unsurprisingly, Lind has always declined as the count works to favor the pitcher:
| Count | Whiff% | Whiff%+ | Look% | Look%+ |
|---|---|---|---|---|
| 0 Strikes | 4.9% | 86 | 35.0% | 105 |
| 1 Strike | 11.6% | 116 | 9.6% | 36 |
| 2 Strikes | 13.6% | 111 | 4.0% | 18 |
The two-strike version of Lind somewhat resembles Jones — a higher rate of called strikes and a lower rate of swinging ones, but overall a similar level of strikeout pitches. Early in the count, when all strikes count the same, they clearly diverge. The former fact explains their analogous strikeout rates, and the latter accounts for the massive disparity in expected strikeout rates.
It’s important to note that Jones is the oddball here, not Lind. With an r-squared of .833, this formula generally doesn’t miss. As the league averages show, most hitters will take Lind’s route, with more whiffs and fewer called strikes in two-strike counts. Rather, this tells us that Lind has historically not possessed the kind of overperforming ability that we witnessed in 2015 — meaning that, in 2016, pitchers will likely punch him out more frequently.
None of this diminishes what Lind accomplished in his first Milwaukee season. He provided the club a rare offensive spark when they lacked those, and for that we should thank him. But I wouldn’t expect him to repeat this in year two, unless he cuts down on his looking or swinging strikes. The Brewers will likely try to import some hitters in the offseason; with a more strikeout-prone Lind, they’ll need all the help they can get.
1 comment on “How Lucky Was Adam Lind In 2015?”