The concept of the sophomore slump, which holds some weight in every walk of life (sporting or otherwise), always seems prominent in baseball analysis. Most evidence suggests that rookies don’t fall off in their second campaign — and that regression to the mean accounts for any decline in performance — yet we still cling to the idea that they’ll stumble when given more opportunities. In some cases, this applies, but not every player will fall victim to it.
Is new Brewer Chase Anderson every player? He’s played two seasons at the major-league level, 2014 and 2015, compiling at least 100 innings in each. According to cFIP, he performed notably worse in the latter year. In terms of DRA, however, he looks to have improved:
| Year | cFIP | cFIP Percentile | DRA- | DRA- Percentile |
|---|---|---|---|---|
| 2014 | 106 | 38th | 109 | 28th |
| 2015 | 110 | 26th | 99 | 43rd |
Percentiles out of pitchers with at least 100 innings.
One metric says he slumped; one says he straightened up. What should we believe?
We should begin with a clarification of the difference between DRA and cFIP. The former attempts to model ERA; in other words, it tries to tells us how well a pitcher actually performed. The latter attempts to model FIP; in other words, it tries to tell us how well a pitcher should have performed. DRA provides greater descriptive value, whereas cFIP has more predictive power. This is not praise or criticism of either metric, but rather a statement of their distinct purposes.
With this in mind, let’s look into the differences between Anderson’s 2014 and 2015 campaigns. The biggest thing to note is that batters hit considerably worse against him in the latter year than they did in the former:
| Year | AVG | OBP | SLG | TAv |
|---|---|---|---|---|
| 2014 | .268 | .330 | .450 | .274 |
| 2015 | .272 | .322 | .432 | .264 |
The decline in on-base percentage occurred because Anderson got his free passes under control, reducing his walk rate from 8.2 percent to 6.3 percent. Simultaneously, he cut down on slugging percentage by lowering his BABIP from .312 to .302 and his home run rate from 3.3 percent to 2.8 percent. Given each of these developments, Anderson clearly seems to have improved between Year One and Year Two.
But not everything went in his favor. For one thing, Anderson benefited from more favorable opponents and environments last season — his opposing TAv fell from .262 to .258, while his pitcher park factor plummeted from 107 to 101. Facing subpar adversaries in less hitter-friendly parks would obviously help him cut down on offense. More importantly, he struggled in the other facet of pitching: strikeouts. He fanned batters 21.6 percent of the time in 2014, which placed in the 72nd percentile among 100-inning pitchers. Then in 2015, he only punched out 17.3 percent of the hitters he faced, putting him in just the 28th percentile. That massive dropoff hurt his case immensely.
Did he deserve any of those changes? Well, the dip in strikeouts looks legitimate. Anderson earned a swinging strike 10.8 percent of the time in his rookie year, which decreased to 9.2 percent of the time in his sophomore year. That meant that he allowed more in-play strikes in 2015 (19.6 percent of pitches) than he did in 2014 (17.9 percent), helping him eliminate bases on balls. And, per FanGraphs, his rate of hard contact dwindled from 31.9 percent to 27.2 percent, which would explain both the BABIP and home runs. So all of these metrics have their merit — but which should we buy into?
Brooks Baseball will help us solve this dispute. A look at Anderson’s arsenal shows fairly uniform trends between the two seasons:
| Pitch Type | Whiff% (2014) | Whiff% (2015) | BIP% (2014) | BIP% (2015) |
|---|---|---|---|---|
| Fourseam | 7.0% | 6.6% | 17.2% | 17.6% |
| Sinker | 4.8% | 4.6% | 21.0% | 23.7% |
| Change | 22.7% | 16.8% | 19.5% | 19.4% |
| Curve | 13.2% | 10.8% | 12.4% | 15.7% |
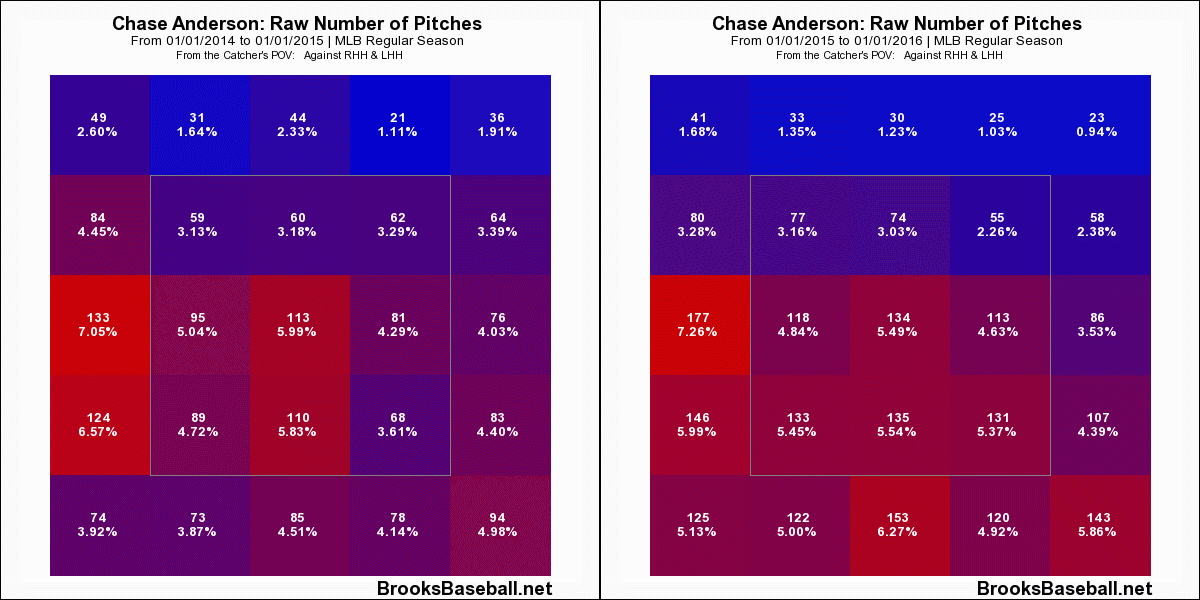
On every pitch, his swinging-strike rate either went down or stayed the same, while his ball-in-play rate either went up or didn’t move. This suggests that no singular offering caused his change, and since he used each of them about the same in the two years, that leaves one possible culprit — location. And here, we see a pretty massive shift:
Anderson moved his entire arsenal down and to the middle. This combination robbed him of his whiffs, while helping him garner more balls in play and keep the ball on the ground. Location alone doesn’t always seem that important, but a monumental shift such as Anderson’s can result in pretty significant changes.
Were those changes for the better or the worse? In the end, we don’t reach an especially firm conclusion. It all depends on how you look at it, and on what metric you use. If you want a high-strikeout power pitcher who attacks hitters up in the zone, then you won’t like the more recent version of Anderson. If you desire a hurler who limits quality contact and avoids free passes, then Anderson might please you. Maybe Anderson had a sophomore slump, or maybe he didn’t — the relevant question for us is how his junior year will turn out.


2 comments on “Did Chase Anderson Have A Sophomore Slump?”