Last year we were promised statcast data. The result, however, was quite underwhelming, as we didn’t receive all of the glowing information we so desired.
With that said, some data started to trickle out. Most people are now familiar with exit velocity, which is the speed at which a ball comes off the bat. We now know that the harder a hitter hits the ball, the better that player is. This is, however, fairly intuitive, but exit velocity has taught us quite a bit more, especially if you combine it with launch angle. This has brought us what is now known as the “doughnut hole”.
Intuitively we would think that the harder the ball is hit, the better chance it has of being a hit, and while that is true for most cases it is not for all cases. Rob Arthur pointed this out specifically in his article, “The New Science Of Hitting,” when he wrote, “Low exit velocities tend to result in short-hoppers to the infielders, which are easy outs. But as batters hit the ball slightly harder, those liners get progressively stronger, eventually sailing over infielders’ heads for bloop singles. Then the run value drops again, as those line drives begin to travel within reach of the outfielders. At a certain point, though, run value skyrockets again as hard-hit balls become doubles and, eventually, home runs.”
Exit velocity and launch angle have a lot of potential and they might bring us new undiscovered statistics that will force us to re-evaluate our notions. With that said, exit velocity and launch angle aren’t the only new data points that statcast has brought us. Another one that started to trickle out last year was perceived velocity.
MLB.com defines perceived velocity as such, “Perceived Velocity is an attempt to quantify how fast a pitch appears to a hitter, by factoring the Velocity of the pitch and the release point of the pitcher.”
Perceived velocity is basically a product of extension. One must first obtain the average extension in order to obtain a pitchers perceived velocity. Basically, a pitcher who’s release point is below the average extension line has a negative perceived velocity and a pitcher who’s release point is above the average extension line has a positive perceived velocity.
I’m not the first to have written about this topic, however, Ben Lindbergh gave us the first look at the metric last year. He found that Carter Capps’ perceived velocity is actually faster than Alrodis Chapman’s thanks to a borderline illegal slide step.
Now that that’s been discovered, I wanted to look at how the Brewers pitchers performed in this department last year. Keep in mind that the X-Axis starts at 80 mph. I did this so that you could better see the difference between both stats, but generally there isn’t a huge difference between velocity and perceived velocity. The pitchers who have the biggest disparity between their velocity and perceived velocity is only around 1 or 2 mph. (Data from Baseball Savant, min. 100 pitches).
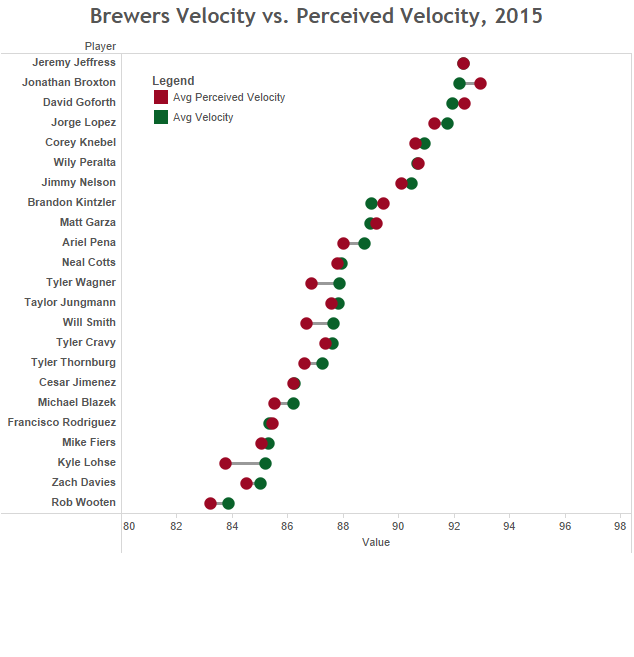
Something you’ll quickly notice is that most pitchers on the Brew Crew have a lower perceived velocity as compared to their actual velocity. In fact, only Jonathan Broxton, David Goforth, Brandon Kintzler, Matt Garza, and Francisco Rodriguez had better-perceived velocities than actual velocity. Leading the pact was Jonathan Broxton who is now with the St. Louis Cardinals with a .75 mph difference between both points.
On the flip side, Kyle Lohse had the second worst perceived velocity on the team, averaging only 83.78 mph, and clearly the biggest negative difference between his actual and perceived velocity. Now, as Spencer Bingol of Beyond the Box Score pointed out, having a bad perceived velocity isn’t a death sentence. This doesn’t mean that a pitcher is doomed to fail. Mike Leake, as Bingol points out, has one of the worst perceived velocities in the league, and still made 80-million this offseason. With that said, having a bad perceived velocity doesn’t help. It basically means that the pitcher’s velocity will not affect the hitter as much as it should due to that pitcher’s release point.
These results also surprised me. I was rather shocked that most of the Brewers pitchers had negative perceived velocities. I, therefore, wanted to see where the team stood as compared to the rest of the league. (Min. 100 pitches).
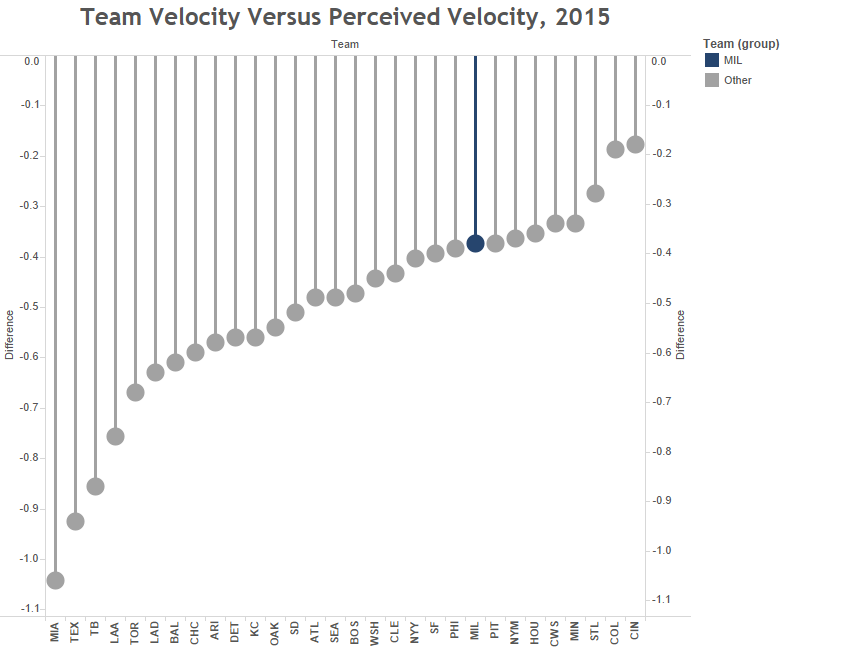
These results surprised me even more. As it turns out, every team has a negative perceived velocity. Or, every team’s average velocity is faster than their average perceived velocity. In this department being smaller or closer to zero is better. It means that one’s perceived velocity matches closer with its actual velocity. The most surprising part of all this was that the Marlins ranked last or had the worst difference even though they have Carter Capps.
The Brewers, have the 9th best difference between perceived velocity and velocity. Now, the Brewers as a team still don’t have many flame throwers, which is the bigger problem. In 2015, the Brewers ranked 22nd in average velocity. Insert their positive perceived velocity and they only jump up to 17th in the perceived velocity ranking. It’s better than 22nd but it’s still not great.
The Brewers as an organization haven’t seemingly put a ton of emphasis on velocity or hard throwers even though it’s becoming an increasingly popular trend. This will obviously have to change going forward as the old adage of “you can’t simply get away with good stuff” doesn’t apply anymore. It’s a bit of a generalization but you get the point: Pitchers have really great stuff, nowadays, and if you can throw quality strikes with great stuff then you’re one of the best pitchers in the game.
The story of perceived velocity has just begun, but it’s unlikely to bring a ton of new insights. There isn’t a ton of difference between actual velocity and perceived velocity. Even though the Brewers had one of the better differences between both metrics, they were still a bad pitching staff in 2015.
Statcast is very exciting and exit velocity matched with launch angle seems to have a ton of potential. Maybe perceived velocity does as well, but it will need to be added to another stat, as perceived velocity on its own doesn’t necessarily tell us a whole lot more than a simple radar gun.
The Brewers starting rotation is small/shorter compared to most in league, Peralta, Anderson, Davis, are all 6-0, 6-1. Nelson our best is 6-6. The Mets staff averages 6-4, the Cubs,6-4. They all release the ball almost a foot closer to plate than Peralta or Anderson.
In Ben Lindbergh’s article he showed that there is a low correlation between height and extension. So, just because a player is short, doesn’t mean he will have a bad perceived velocity. The Brewers as a team, also, have one of the better differences between there actual and perceived velocity.
Another good read, Julien. My favorite article on perceived velocity is this one, which also touches on location as a contributing factor (in addition to release point) in the context of effective velocity: http://www.sbnation.com/longform/2014/6/18/5818380/effective-velocity-pitching-theory-profile-perry-husband.
Thanks for the compliment and the link AD. I’ll give it a read when I get the chance