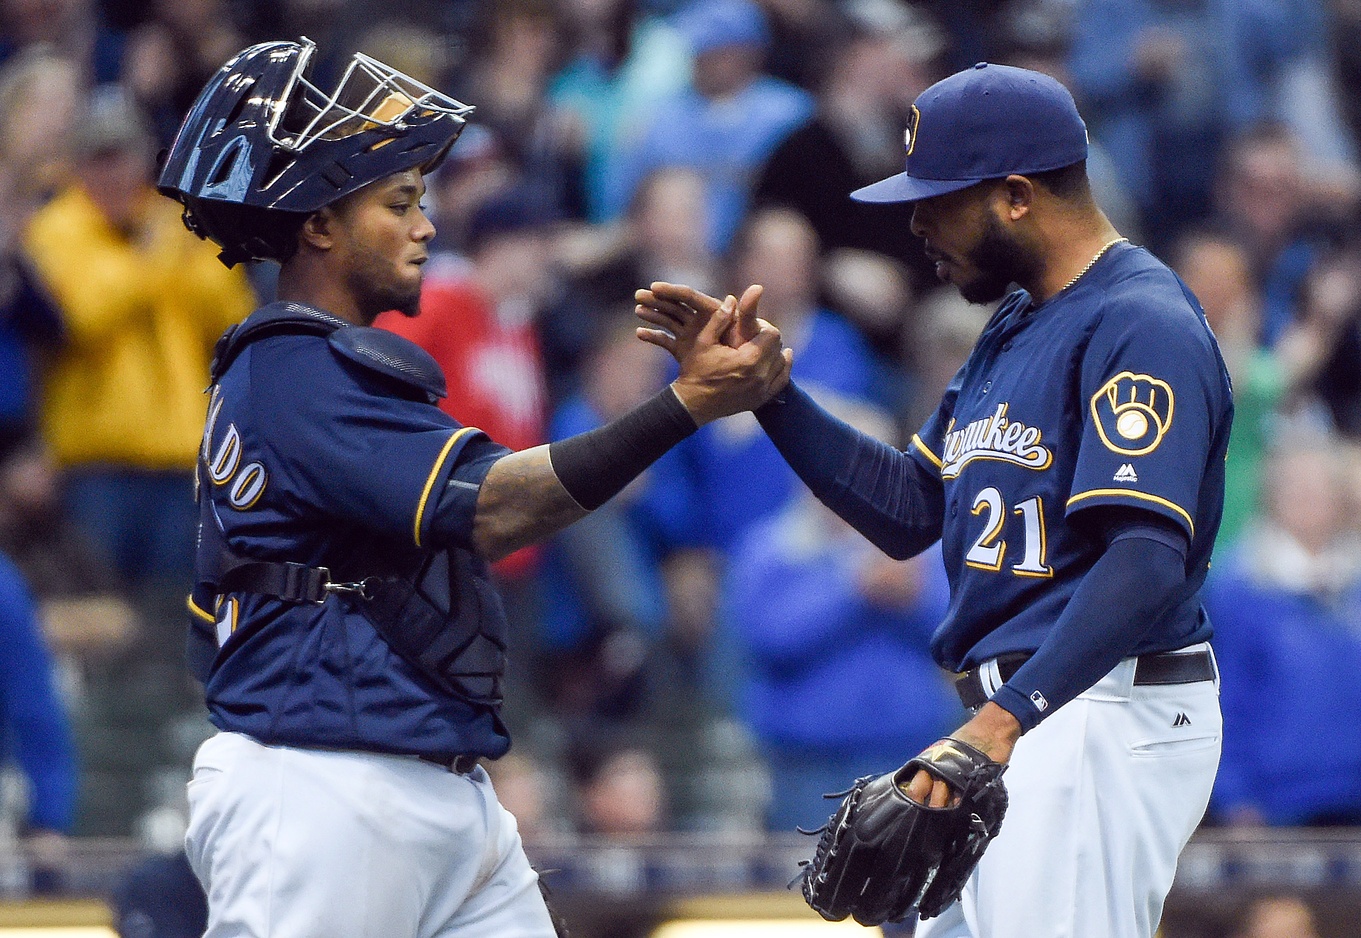
Central in the Great Brewers Pitching Meltdown of 2016 has been a complete loss of control, on the part of pretty much everyone. The rotation has the seventh-worst walk rate in baseball, at 9.3 percent, and the bullpen’s 11.2 percent clip ranks third-to-last. Taylor Jungmann walked so many batters, he went down to Triple-A (where he’s done the same thing). Wily Peralta has looked even worse than last year, and Michael Blazek’s command has vanished, and…and…the Brewers can’t really throw strikes, is the point.
But the team has managed to come out ahead in one area. In terms of the difference between strikes and expected strikes, they nearly lead the majors:
| Rank | Team | Str% | xStr% | Diff |
|---|---|---|---|---|
| 1 | Pirates | 62.7% | 61.6% | 1.1% |
| 2 | Dodgers | 64.9% | 63.9% | 1.0% |
| 3 | Brewers | 62.0% | 61.1% | 0.9% |
| 4 | Orioles | 63.3% | 62.5% | 0.8% |
| 5 | Astros | 64.1% | 63.3% | 0.8% |
| 6 | Yankees | 64.9% | 64.1% | 0.8% |
| 7 | Rockies | 63.2% | 62.6% | 0.6% |
| 8 | Giants | 65.4% | 64.8% | 0.6% |
| 9 | Cardinals | 64.7% | 64.2% | 0.5% |
| 10 | Cubs | 64.5% | 64.1% | 0.4% |
| 11 | Diamondbacks | 62.9% | 62.5% | 0.4% |
| 12 | Rays | 63.5% | 63.2% | 0.3% |
| 13 | Blue Jays | 64.0% | 63.7% | 0.3% |
| 14 | Padres | 61.2% | 61.1% | 0.1% |
| 15 | Angels | 64.4% | 64.3% | 0.1% |
| 16 | Rangers | 63.0% | 63.0% | 0.0% |
| 17 | Mets | 67.7% | 67.7% | 0.0% |
| 18 | Marlins | 61.8% | 61.8% | 0.0% |
| 19 | Red Sox | 62.6% | 62.6% | 0.0% |
| 20 | Braves | 63.6% | 63.7% | -0.1% |
| 21 | Phillies | 64.2% | 64.3% | -0.1% |
| 22 | Indians | 63.9% | 64.0% | -0.1% |
| 23 | Royals | 63.1% | 63.3% | -0.2% |
| 24 | Mariners | 64.3% | 64.5% | -0.2% |
| 25 | Nationals | 65.5% | 65.8% | -0.3% |
| 26 | Reds | 60.5% | 60.8% | -0.3% |
| 27 | Twins | 63.4% | 63.9% | -0.5% |
| 28 | Tigers | 63.2% | 64.1% | -0.9% |
| 29 | Athletics | 62.8% | 63.8% | -1.0% |
| 30 | White Sox | 63.0% | 64.1% | -1.1% |
Let’s back up for a second. FanGraphs (and BP, except not on a team level) offers various PITCHf/x plate discipline metrics. These include the rate of pitches inside the strike zone, and the rate of swings at pitches outside the strike zone. With both of these, we can make expected strike rate — given by:
xStr% = 1 – (1 – Zone%) * (1- O-Swing%)
Then, by comparing that with Baseball-Reference’s strike rate that excludes intentional balls, we get this metric, a measure of overperformance. For the Brewers, a 46.6 percent zone rate combined with a 27.1 percent O-Swing rate yields a 61.1 percent expected strike rate, nearly a full percentage point lower than their actual strike rate. Basically, the Brewers have stolen a lot of strikes this season, ranking behind only the Pirates. You can’t walk a batter if you don’t throw any balls, so this obviously helps the Brewers.
Extra strikes are a two-way street. Catchers, as we’ve all heard by now, can frame pitches to fool umpires into calling them strikes. The Brewers backstops haven’t really done this, though. Jonathan Lucroy and Martin Maldonado have combined to save 0.8 runs with their framing, according to BP’s FRAA data. For the sake of comparison, 21 individual catchers have at least a full run saved by called strikes. Pittsburgh’s gotten 2.7 runs from its catchers; Los Angeles, 5.2 runs; Baltimore, 5.9 runs; and Houston, 9.7 runs. Only Milwaukee has had mediocre catching, which means the pitchers deserve most of the credit.
Or do they? The role of pitchers in stealing strikes seems pretty clear: Throw the ball on the edge of the strike zone, and the catchers will do their best to present it. But the Brewers haven’t painted the corners in 2016 — per Bill Petti’s data, their 26.4 percent Edge rate ranks just 16th in the majors. While that’s certainly better than they performed last year, when they posted the worst Edge rate in all of baseball at 24.9 percent, it still doesn’t explain their overperformance.
The likelier cause, in my mind, is random variation — i.e., umpires. With average catchers (in terms of framing) and average pitchers (in terms of command), the Brewers should probably have an average disparity between expected and actual strikes. It seems like they’ve just had some pitcher-friendly umpires to this point, and going forward, I wouldn’t expect that to continue. As bad as things have been for the Brewers in 2016, they could get even worse if they don’t start throwing more legitimate strikes.
All statistics as of Wednesday, May 25th.

1 comment on “The One Thing That’s Gone Right For Milwaukee Pitchers”