
The story of Eric Sogard’s 2017 season can be a loosely tied metaphor to this current Brewers campaign. I emphasize the word loose, because Sogard was once batting in the .400s. The Brewers were never that good. However, through April and May, the entire league was patiently waiting for the Brewers to regress some bit, or for the Cubs to rip off a winning stretch to reclaim the division lead. Now at the end of June, the Brewers still stand there at the top! They have been fueled by slightly under-.500 baseball, and have no doubt been lucky that division counterparts continue to underperform expectations.
When Sogard was called up in May, #NerdPower ensued, and was analyzed on BPMilwaukee by Colin Anderle. Sogard finished the month at a .400 batting average clip, a 26.5 percent walk rate, and a .387 BABIP. Sogard was bound to regress and regress hard.
In June, Sogard’s walk rate (seemingly his main claim to legitimacy), has diminished, while his strikeout rate has bloomed. It seemed as if his plate discipline was keeping him alive. However, with a June walk percentage of 7.8 and a strikeout percentage of 16.5, Sogard is still hitting .315 on the month, and his season batting average (.339) would tie for second in baseball, if he qualified.
To continue the metaphor, Sogard simply won’t go away. Like the Brewers, some regression is still to come, but signs of legitimacy continue to arrive. How is Eric Sogard sustaining his success?
The answer can be pointed at on an advanced stat sheet, for surface level analysis. His BABIP is still inflated, down just nine points from .387 in May to .378 in June. But in diving deeper into his batted ball statistics, Sogard is making much better contact when he hits the ball.
Sogard’s low hard contact rate in May has jolted up to a semi-respectable number in June. The same can be said about spreading the ball to all fields. Sogard has always sprayed the ball well across the diamond, but his batting results have come much closer to each other than in May. This type of variation limits predictability and enhances his chances of getting on base.
Sogard, in short, has been making more efficient contact with the ball. Not necessarily better, because he is making less contact with the ball, but he’s hitting it much harder. This could be due to his recent freer-swinging tendencies in comparison to May. As mentioned before, his walk rate has dropped from 26.5 percent in May to 7.8 percent in June, while his strikeout rate has quadrupled in that timeframe.
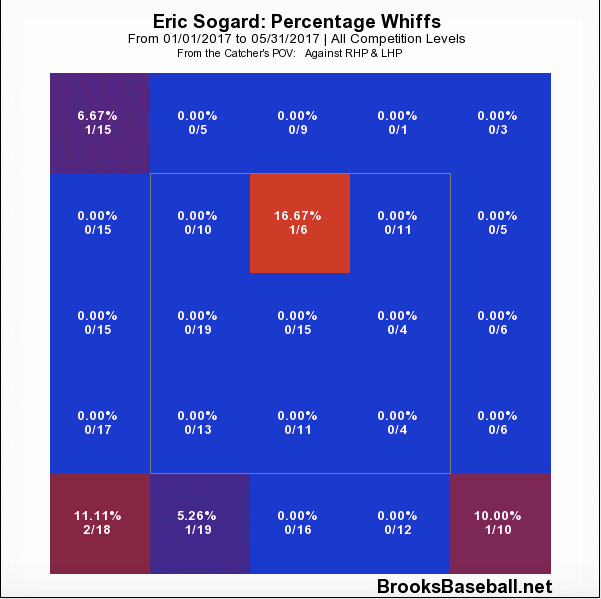

In June, Sogard has been whiffing much more on low pitches outside of the strike zone. This trend is obviously concerning, and explains his diminishing plate discipline numbers.
Sogard’s whiff rate heat map makes his continued production that much more incredible, and puzzling. His plate discipline looked to be the sole fingernail clinging to a cliff above regression. However, in abandoning a solid BB/K ratio, Sogard has continued to tread water. The 5’10 lefty is finding new ways to fight off regression, and, like the Brewers, it has lasted much longer than we all thought.
Photo Credit: Jeff Curry, USAToday Sports Images