The Brewers won the division 350 times in 2017. 350 times out of 5,000, the Brewers were better than the Cubs, Pirates, Cardinals, and Reds.
In the preseason, Baseball Prospectus alumnus Sam Miller published a fun perusal of the PECOTA oddities generated during playoffs odds simulations at ESPN. Of course, the Brewers were hardly on Miller’s radar, and no one can really blame him for that: it was a fun piece looking at the full league, and in that context it was just as entertaining to read about the Reds projections to beat the Cubs as it would be reading about the Brewers projections to beat the Cubs.
But the Brewers indeed won the division, quite a bit, during the simulations: the simulations placed the Brewers atop the NL Central in 350 of 5,000 simulations. Forget the fact that that means 93 percent of the time, Milwaukee did not win the division in 2017. What might reality hold in that seven percent?
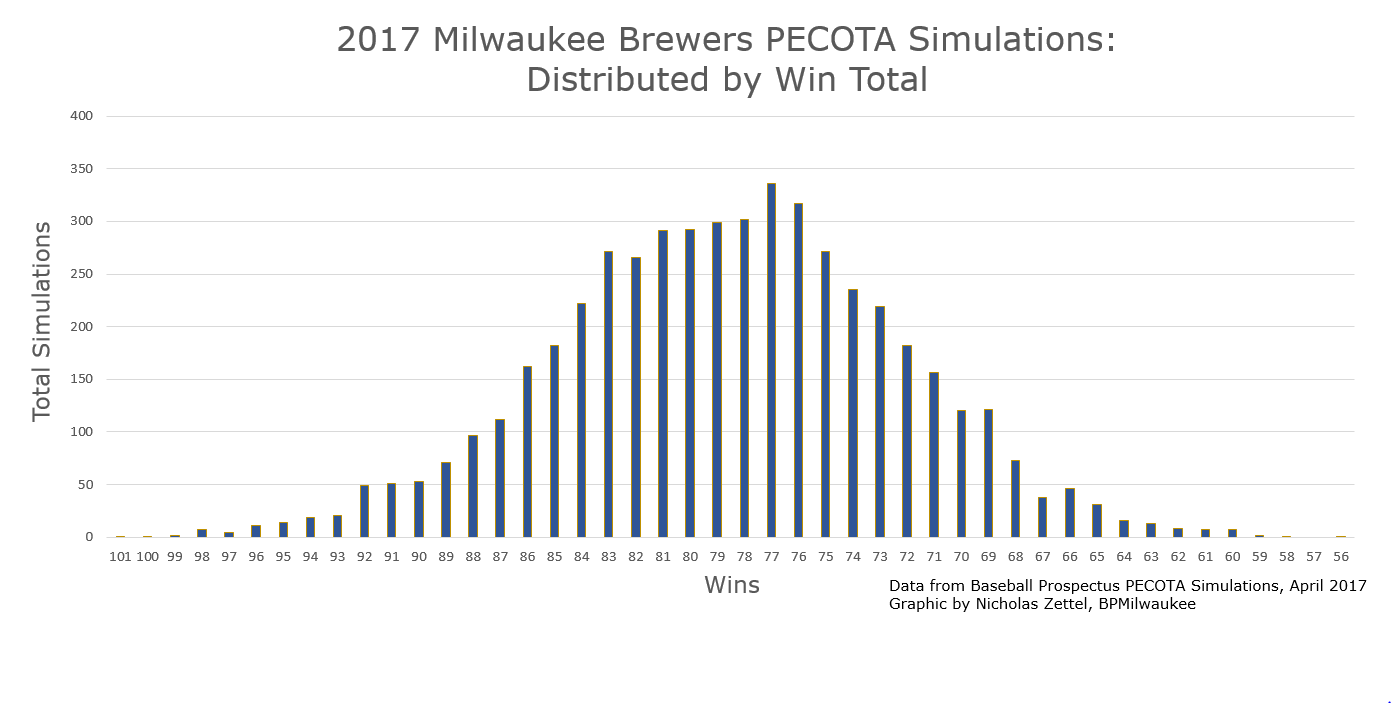
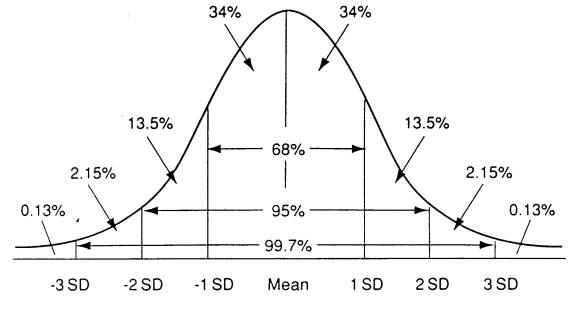
Thanks to Jonathan Judge and Rob McQuown, I had the opportunity to peruse the Baseball Prospectus simulations to evaluate Brewers related oddities. It should be stated that the beauty of the projections is that the PECOTA preseason W-L for the Brewers indeed comprised a standard distribution within the projections. The average PECOTA winning percentage for the Brewers resulted in 78.7 wins; following the basic observation that one standard deviation for a baseball club’s record is approximately six wins, Brewers seasons from 84 wins to 72 wins comprise 3,510 (70.2 percent) of simulations, and Brewers seasons from 85 wins to 73 wins also comprise 3,510 simulations. This arc of win totals is glorious in its beauty.

[The Brewers Simulation Curve]
The fun with this projection system is that Milwaukee’s 2017 average W-L drawn from Daily Pythagorean W-L estimates (or, estimated W-L based on park adjusted runs scored and runs allowed) has hovered around 85 wins throughout the year. In other words, Milwaukee’s “true” 2017 pace stands on the normal curve projected by Baseball Prospectus (albeit on the highest end of one standard deviation), and that 85 win pace represented 182 results in the projections (3.6 percent).
On the other hand, the Brewers’ primary nemesis, those pesky Lakeview Nine, averaged a PECOTA winning percentage of approximately 89.5 entering 2017. While this seems like quite a stumble from the 107 win run differential that drove the 2016 campaign, the normal curve says it isn’t all bad for the Cubs. Taking the high end, simulations saw 3,503 seasons between 96 and 84 wins (70.1 percent) and 3,511 simulations between 95 and 83 wins (70.2 percent). Anyway, 274 simulations picked the Cubs with more than 100 wins (5.5 percent), so it’s not like PECOTA was picking on the Cubs (Chicago winning more than 100 games would be about as probable as Milwaukee winning 83 or 75 games, for example).
| 2017 Normal Curves | Win Range | Simulations | Percentage |
|---|---|---|---|
| Brewers Normal A | 85 to 73 | 3510 | 70.2 |
| Cubs Normal A | 96 to 84 | 3502 | 70.1 |
| Brewers Normal B | 84 to 72 | 3510 | 70.2 |
| Cubs Normal B | 95 to 83 | 3511 | 70.2 |
In an extremely important way, the 2017 season is not really a divergence in the respective narratives of the Cubs and Brewers. Milwaukee is on the high end of their most probable range of seasons during a year in which they were highly probable to improve anyway; Chicago is on the low end of their most probable range of seasons during a year that will be one of several in a true win-now window. The Cubs are indeed contenders, but maybe 2017 is the year they stumble a bit, with those bombastic Big Red Machine and Hall of Fame ruminations coming a bit too early. Obviously, “divergent paths on the normal curve” won’t sell newspaper headlines, so instead everyone will wonder “what’s wrong with the Cubs?” or “are the Brewers for real?” In the big picture? (a) Nothing is wrong with the Cubs, and (b) Yes, the Brewers are “for real.” It’s all along the normal curve.
Following the Sam Miller mold, let’s look at some simulations. We’ll get to some in which the Brewers won the division, but first let’s see some intriguing scenarios in which the Cubs did not win the division.
Simulation 940
There will undoubtedly be some bizarre distributions throughout 5,000 MLB season simulations, including some small market triumphs. Unfortunately, Simulation 940 saw Milwaukee unable to capitalize on a relatively competitive division, and the upstarts took a more traditional rebuilding path with 67 wins and the Second Overall pick in the 2018 Amateur Draft (the #WinNever faction would undoubtedly be thrilled with this result). But, the remaining season would have been fantastic, with success in Cincinnati, Cleveland, Tampa Bay, Oakland, and Minnesota.
| Team | Division | Wins | Finish |
|---|---|---|---|
| Cardinals | NL-C | 86 | 1 |
| Reds | NL-C | 83 | 2 |
| Pirates | NL-C | 80 | 3 |
| Cubs | NL-C | 78 | 4 |
| Brewers | NL-C | 67 | 5 |
| Mets | NL-E | 81 | 1 |
| Giants | NL-W | 89 | 1 |
| Cleveland | AL-C | 98 | 1 |
| Rays | AL-E | 93 | 1 |
| Athletics | AL-W | 86 | 1 |
| Dodgers | NL-W | 87 | WC |
| Padres | NL-W | 84 | WC |
| Twins | AL-C | 86 | WC |
| Blue Jays | AL-E | 85 | WC |
It’s not terribly hard to squint and see this particular Brewers team. Maybe Jimmy Nelson takes another year to work on those mechanical shifts, or they don’t shift his performance as effectively as fans are currently witnessing. In this scenario, Eric Thames might not have a scorching hot April, Domingo Santana continues to struggle with strike zone contact, and the bullpen does not feature huge performances by Corey Knebel, Jacob Barnes, or a turnaround by Jarrod Hughes. This is not to criticize any of these players, but to recognize that baseball mechanics are always in motion, and perhaps the 67-win Brewers take a step back while everyone is ironing out their respective approaches.
Simulation 187
I picked this simulation while looking for seasons in which the Cubs finished last (there were 65 such simulations). Here, Milwaukee was unable to capitalize on a relatively weak division. What’s fascinating here is the three-way jam-packed NL West, the Tigers (presumably) as deadline buyers, and the Mets playing as NL East favorites.
| Team | Division | Wins | Finish |
|---|---|---|---|
| Cardinals | NL-C | 86 | 1 |
| Brewers | NL-C | 83 | 2 |
| Reds | NL-C | 80 | 3 |
| Pirates | NL-C | 78 | 4 |
| Cubs | NL-C | 72 | 5 |
| Mets | NL-E | 95 | 1 |
| Giants | NL-W | 88 | 1 |
| Tigers | AL-C | 91 | 1 |
| Red Sox | AL-E | 90 | 1 |
| Astros | AL-W | 87 | 1 |
| Dodgers | NL-W | 88 | WC |
| Rockies | NL-W | 88 | WC |
| Cleveland | AL-C | 84 | WC |
| Yankees | AL-E | 83 | WC |
So, an 83 win Brewers club would not be all that surprising in 2017, given the current position of the club. Should Milwaukee’s front office fail to add to the starting rotation or make an additional depth move to improve late game roster moves, a shift to about 83 wins would not be far from an expected regression back to the 85 win mean run differential. But it’s fun to look at projections and ask, “What could have gone differently for each 83 win Brewers club?” Maybe this 83 win club does not feature a Neftali Feliz meltdown, or Travis Shaw does not emerge as one of the best third basemen in the National League, or Ryan Braun plays a full and productive season that is offset by a bunch of plate appearances by prospects after the trade deadline.
Incidentally, if one considers the Brewers’ “true” daily run differential average of 85 wins to be a success, the 85 win projections were not always great by PECOTA’s standards. Milwaukee finished with 85 wins in 182 simulations (3.6 percent). Here’s a handful of fun seasons, with the forewarning that, given the current 2017 standings, simulations #491 and #4954 will look like disasters to Brewers fans:
| 85 W Sims | Brewers Finish | Division Winner (W) | Best NL Team (W) | Best AL Team (W) |
|---|---|---|---|---|
| #2 | Third | Cardinals (89) | Mets / Giants (91) | Blue Jays (93) |
| #183 | Fourth | Cubs (94) | Cubs (94) | Astros (95) |
| #491 | Second | Cubs (88) | Dodgers (95) | Astros (92) |
| #2207 | Third | Cubs (92) | Cubs (92) | Astros (93) |
| #3433 | Third | Cubs (99) | Cubs (99) [Dodgers 98] | Astros (94) |
| #4954 | Third | Cardinals (89) | Mets (94) | Astros (97) [Rays 94!] |
What of the Brewers winning the division? Here are a few good ones…
Simulation 716
This one actually seems a bit mundane, considering that a Cubs rotation meltdown through the stretch run and a return of the offensive inconsistency does not make this particular NL Central picture all that unlikely in 2017. But I picked this one because the playoffs would be great:
| Team | Division | Wins | Finish |
|---|---|---|---|
| Brewers | NL-C | 86 | 1 |
| Cubs | NL-C | 79 | 2 |
| Cardinals | NL-C | 79 | 3 |
| Pirates | NL-C | 77 | 4 |
| Reds | NL-C | 69 | 5 |
| Nationals | NL-E | 87 | 1 |
| Dodgers | NL-W | 93 | 1 |
| White Sox | AL-C | 91 | 1 |
| Rays | AL-E | 88 | 1 |
| Rangers | AL-W | 85 | 1 |
| Mets | NL-E | 84 | WC |
| Phillies | NL-E | 84 | WC |
| Tigers | AL-C | 88 | WC |
| Cleveland | AL-C | 86 | WC |
Could you imagine the Phillies and Brewers repeating a playoff series a decade after Milwaukee stormed the Wild Card? This time both Philadelphia and Milwaukee would be upstart teams, which is kind of stunning when you think about it: despite having an almost certain mini-dynasty a decade ago, both clubs are now basically on a similar trajectory (rebuilding youthful team for future contending). I’m obviously 100 percent all-in on the Rays-Brewers World Series, which would certainly draw the greatest ratings of any Series in history.
Simulation 4267
Imagine the strengths of the current Brewers club, and add in perhaps a healthy and continually improving elite aging Ryan Braun, Junior Guerra and Zach Davies as their 2016 dynamic duo and Chase Anderson and Jimmy Nelson take a step forward. Perhaps Neftali Feliz does not metldown, leaving Jacob Barnes and Corey Knebel two wicked set-up men leading to the closer. It’s so easy to dream of everything going right, that it’s easy to forget that even 101 win teams have problems. Wouldn’t it be strange if the 101 win Brewers still did not have a Jonathan Villar sustained breakout in 2017? Or maybe the bullpen still has some trouble holding leads and it’s Jett Bandy, Hernan Perez, and the Brewers depth options that win late and close games.
| Team | Division | Wins | Finish |
|---|---|---|---|
| Brewers | NL-C | 101 | 1 |
| Cubs | NL-C | 86 | 2 |
| Cardinals | NL-C | 80 | 3 |
| Reds | NL-C | 67 | 4 |
| Pirates | NL-C | 65 | 5 |
| Atlanta | NL-E | 87 | 1 |
| Dodgers | NL-W | 101 | 1 |
| Cleveland | AL-C | 82 | 1 |
| Blue Jays | AL-E | 90 | 1 |
| Rangers | AL-W | 89 | 1 |
| Diamondbacks | NL-W | 88 | WC |
| Cubs | NL-C | 86 | WC |
| Orioles | AL-E | 88 | WC |
| Red Sox | AL-E | 85 | WC |
In this scenario, perhaps the Brewers edge the Dodgers, knock off the defending Champion Cubs in a rowdy LCS, and face Jonathan Lucroy and the Texas Rangers in the World Series. How ya like rebuilding now, Johnny? In an almost certain press interview, Manny Pina would say, “catching Nelson, Anderson, Guerra, and Davies makes me feel like I got the keys to the Mercedes.”
Simulation 520
Just taking a quick divergence to say that I’d love to watch this divisional race:
| Team | Division | Wins | Finish |
|---|---|---|---|
| Brewers | NL-C | 83 | 1 |
| Pirates | NL-C | 83 | 2 |
| Reds | NL-C | 82 | 3 |
| Cubs | NL-C | 79 | 4 |
| Cardinals | NL-C | 78 | 5 |
Simulation 244
Indeed, it would not be a full exploration of the simulations if I ignored the Brewers’ projected Division Championship….with a losing record. Let’s dive in:
| Team | Division | Wins | Finish |
|---|---|---|---|
| Brewers | NL-C | 80 | 1 |
| Cubs | NL-C | 79 | 2 |
| Pirates | NL-C | 77 | 3 |
| Reds | NL-C | 72 | 4 |
| Cardinals | NL-C | 66 | 5 |
| Nationals | NL-E | 97 | 1 |
| Giants | NL-W | 101 | 1 |
| Twins | AL-C | 88 | 1 |
| Blue Jays | AL-E | 88 | 1 |
| Angels | AL-E | 88 | 1 |
| Dodgers | NL-W | 95 | WC |
| Mets | NL-E | 90 | WC |
| Cleveland | AL-C | 87 | WC |
| Red Sox | AL-C | 87 | WC |
It’s tough to look at this list and not see the Brewers being dismissed in the playoffs. But, what fun is that? I’m guessing this 80 win Brewers club persevered through more bullpen turmoil, a starting rotation that couldn’t quite make it, and an inconsistent offense to hold off those pitching poor Cubs who just never improved in 2017. Here, I’d take the Twins-Brewers World Series (if Milwaukee gets out of the first round). Overall, this is an interesting twist on the Pythagorean Ideal that the Brewers and Cubs are on a crash course for finishing within one game of one another; it would be fascinating if both clubs backed into the division race.
Simulation 1823
Back to an extremely competent Brewers club, this time visiting all of the ghosts of playoffs past:
| Team | Division | Wins | Finish |
|---|---|---|---|
| Brewers | NL-C | 90 | 1 |
| Cardinals | NL-C | 86 | 2 |
| Reds | NL-C | 82 | 3 |
| Cubs | NL-C | 80 | 4 |
| Pirates | NL-C | 77 | 5 |
| Phillies | NL-E | 85 | 1 |
| Dodgers | NL-W | 91 | 1 |
| Tigers | AL-C | 93 | 1 |
| Red Sox | AL-E | 90 | 1 |
| Mariners | AL-W | 94 | 1 |
| Diamondbacks | NL-W | 88 | WC |
| Cardinals | NL-C | 86 | WC |
| Cleveland | AL-C | 92 | WC |
| Rangers | AL-W | 83 | WC |
This Brewers club gets the chance to knock off former playoff nemeses Arizona or St. Louis, and perhaps exorcise the Phillies demons within the same playoffs. After that trip through the National League playoffs, I’m imaging the Brewers facing their former city, Seattle, in an epic World Series. Given both clubs’ respective win totals, I’m imagining Junior Guerra facing off against Hisashi Iwakuma in the battle of former age-31 splitter ball rookies.
Those 90 win Brewers are not too far off in the distance, just a few notches beyond the normal curve. If 2017 persists, the club can beat the Cubs without either club straying from the normal distribution of their talent. But that’s not to say anyone would complain if Milwaukee kicked it into overdrive, allowing the improbable to become something greater in 2017.
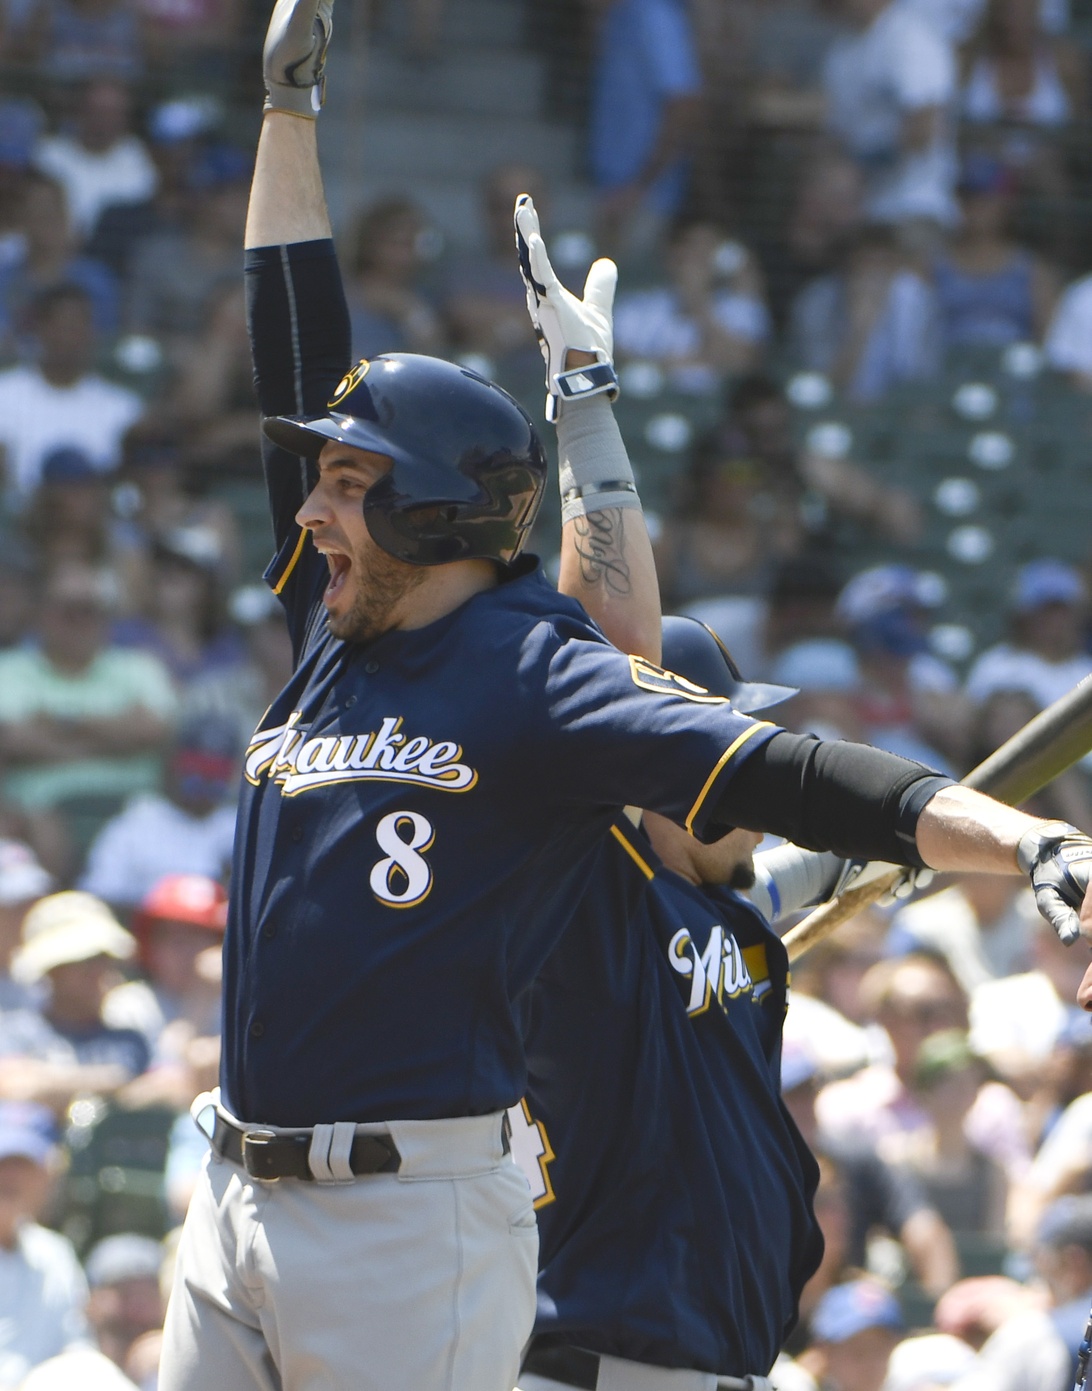
Photo Credit: David Banks, USAToday Sports Images
Thank you to Jonathan Judge and Rob McQuown for helping me out! All good ideas & data here are thanks to them, all mistakes & bad ideas are mine.

