Travis Shaw has undoubtedly had a better season this year than last. In roughly the same number of plate appearances (562 thus far in 2017, compared with 530 last season), he has a TAv nearly fifty points higher and has more than doubled his WARP. Entering the weekend against Miami, his .292 TAv ranked fifty-first among all hitters with at least 400 plate appearances, and his WARP put him comfortably atop the team’s position players. Shaw has 30 home runs, after hitting only 16 last year, and his .523 SLG is a full one hundred points higher than his .421 mark last season.
Shaw’s improvement this season has a few obvious causes. First, he has improved both his strikeout and walk rates. His walk rate has jumped from 8.1 percent to 9.8 percent, while his strikeout rate has dropped from 25.1 percent to 23.3 percent. Improved plate discipline generally helps on base percentage, but it can also indicate a hitter is being more selective about which pitches to swing at and thus more likely to make better contact. Second, though, Shaw’s HR/FB rate has nearly doubled. The extent to which such an increase is sustainable is unclear; my instinct is to say that he will regress back towards what he did last year, but his 2015 performance, in about half a season’s worth of plate appearances, more resembles this year than last. As is generally the case, I suppose, he is likely to settle somewhere between the two extremes.
Statcast provides a lot of information about the quality of contact that we did not have previously, and this research project actually began with me digging into the difference between his Statcast outputs from this year and last year. As the table below demonstrates, Shaw is not hitting the ball harder this year than he was last year. In fact, his exit velocity on balls hit in the air has decreased, as has his percentage of hard-hit balls.
Entering the weekend against Miami, Shaw’s Statcast performance compared to 2016:
| Year | BBE | Max EV | Avg EV | Avg FB/LD EV | Avg GB EV | Max DST | Avg DST | Avg HR Dist |
| 2016 | 353 | 113.8 | 88.4 | 93.2 | 84.5 | 458 | 187 | 402 |
| 2017 | 351 | 112.3 | 88.5 | 92.8 | 85.2 | 449 | 199 | 407 |
| 95 mph+ | % | Barrels | Barrels/BBE | Barrels/PA |
| 135 | 38.2% | 29 | 8.2% | 5.5% |
| 122 | 34.8% | 28 | 8.0% | 5.3% |
Last week, though, Jeff Sullivan published a piece on FanGraphs observing that hitters league-wide are making better contact on balls hit into the air, so I wondered if that might explain the apparent disparity between process and results. Consequently, the two graphics below show Shaw’s launch angle and exit velocity from 2016 (left) and 2017 (right). Although the two years look similar on the surface, Shaw is making better contact on balls with a launch angle above 25 degrees. In fact, in 2017, his average exit velocity on balls with a launch angle of at least 25 degrees is 87.5 mph, while in 2016 it was 86.6.
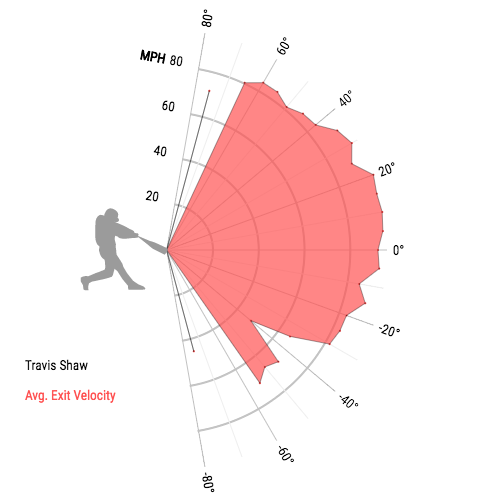
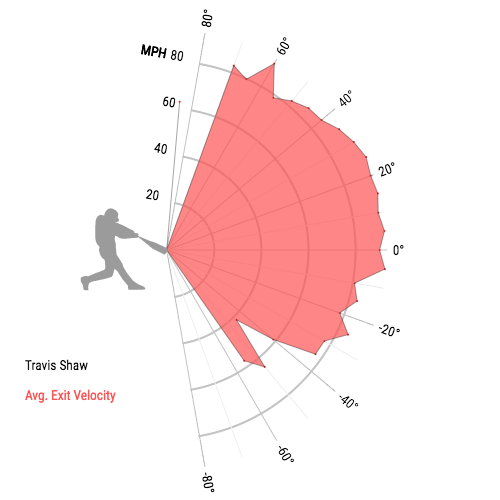
It will take more years of data and someone with more of a statistical background than I have to determine exactly how consequential that jump it is. However, a full mile per hour seems significant given the way so many players’ average exit velocities bunch together on the overall Statcast exit velocity leaderboard.
If this type of improvement is real and Shaw’s overall performance improves despite his making worse contact, the consequences seem relatively significant. Based on general knowledge of baseball through a few years ago, I would have thought that Shaw’s performance this year was unsustainable because his exit velocity dropped and so he was just getting lucky that more of his fly balls went over the fence. But if he is trying to hit more fly balls and is doing so successfully, then his overall contact numbers are less important than those numbers on just balls in the air.
None of this fills me with enough confidence to predict what Shaw will be going forward. I am less confident in predicting regression automatically than I otherwise would have been, though, so I will hold off on bold proclamations. We have not previously been able to examine hitting data in this much detail, so it is possible that these year-to-year fluctuations existed previously and we just could not find them. It is also possible that this trend is new and that Shaw is capitalizing on the shift in how baseball is played. What plays out over the next couple years will help answer that question.
Photo Credit: Charles LeClaire, USAToday Sports Images.
“Launch Angle Breakdown.” MLB Advanced Media, LP., 2017. Retrieved from baseballsavant.mlb.com.