On August 31, the Brewers boasted a respectable 76-60 overall record, and stood four games behind the division leading Cubs entering the last month of the season. Yet the Brewers’ fate might have felt sealed: Milwaukee posted their worst pitching performance in August (-42 Runs Prevented), offsetting a strong offense that notably improved following trade deadline moves.
Runs Prevented Worksheet: End of Season
https://docs.google.com/spreadsheets/d/1kf2hMxo9p4H92R7S5N7y-_d-AhrayPJgGFXjPKLpKDs/edit?usp=sharing
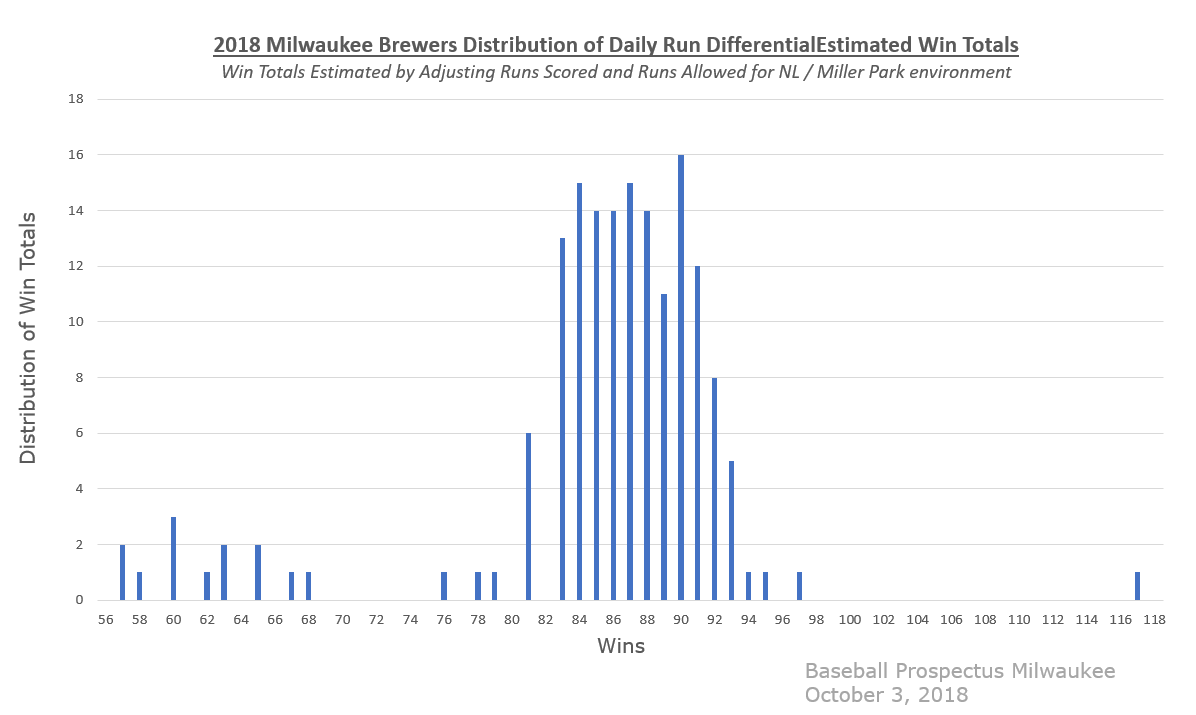
Milwaukee’s park-adjusted run differential reflected these uncertain elements at the end of August, as the club was basically a “true” 83-win team, posting an overall -2 Runs Scored / +27 Runs Allowed performance on the year. This matched their overall trajectory as an 85-win club, which is calculated from the average of their Daily Pythagorean records.
And so the Brewers surged. Our beloved Milwaukee Nine played their best baseball to close the season, a stunning reversal of the collapse expectations that seasoned Brewers fans fearfully expressed. There was no collapse in this team, nor were the 2018 Brewers simply a .500 team following an excellent May performance; this club would recover after August. Given the timing of the now-infamous comments by Cubs southpaw Cole Hamels about the lack of a rivalry with Milwaukee’s southern neighbors, one would be forgiven if they thought the Brewers were making a statement. Now that dynasty is unseated; the previous comparisons seeking The Big Red Machine and other great clubs experiencing long-term success are done for the Cubs. There is no dynasty in Chicago.
| Monthly Brewers | RS / RA | Park | Performance |
|---|---|---|---|
| March | 17 / 10 | +4 / +3 | +7 |
| April | 96 / 97 | -24 / +22 | -3 |
| May | 132 / 104 | +12 / +15 | +26 |
| June | 115 / 96 | +4 / +14 | +17 |
| July | 118 / 118 | -7 / +5 | -2 |
| August | 126 / 156 | +13 / -42 | -29 |
| September | 144 / 77 | +28 / +37 | 65 |
| October | 3 / 1 | -1 / +3 | 2 |
After 163 games, the Brewers are many things: they are still an “average” 85 win team based on their underlying Runs Scored / Runs Allowed elements. They remain a team that outperformed their run differential on the field, mostly thanks to an excellent bullpen and efficient defense. According to Baseball Prospectus Overall and Park-Adjusted Defensive Efficiency statistics, the Brewers can claim a true top five fielding unit in the MLB. The beauty of this defensive alignment was no more evident than at Game 163 in Wrigley Field, where the Milwuakee fielders morphed into alien shapes and swapped positions at will to produce the best possible arrangements. (May it be known that I even saw Mike Moustakas cross the diamond to play second base at one point and time, while Jonathan Schoop and Orlando Arcia seamlessly traded places depending on the pitch count). Yet even if Milwaukee was an inconsistent offensive team earlier in the season, the bats have picked up the club since the July 31 non-waiver trade deadline, and improved mightily in September. This simply is not due to MVP-candidate Christian Yelich, who basically sealed the deal on the MVP vote with his stunning September, but also due to successful performances around the diamond. When I last considered the MVP ballot, Milwaukee boasted four players in the top 25 percent of National League regulars (Yelich, Lorenzo Cain, Jesus Aguilar, and Travis Shaw).
If Milwaukee’s season seems strange, they have an equally bizarre League Divisional Series foe in the Colorado Rockies. The Rockies spent much of their season as a sub-.500 club in terms of Run Differential, and only recently climbed into the black. In fact, when I previewed the NL Playoff Sprint toward the end of August, the Rockies averaged a daily run differential worth approximately 73 wins; they averaged an 83 win pace on the season. This series has the “trap” appearance of a weakness-versus-strength arrangement, as the Rockies have the worst offensive unit in the Playoffs, while the Brewers’ strength is their pitching staff (and yes, this is a strength for both their rotation and their bullpen, even though the bullpen gets top bill).
| 2018 NL | Wins | RS / RA (Park) | Overall |
|---|---|---|---|
| Dodgers | 92 | +106 / +74 | +180 |
| Cubs | 95 | -1 / +110 | +109 |
| Atlanta | 90 | +51 / +51 (!!!) | +102 |
| Brewers | 96 | +27 / +60 | +88 |
| Rockies | 91 | -53 / +81 | +28 |
This is also a unique series, as compared to the American League, most National League playoff teams lag behind for overall run differential performance. Colorado is the “worst” team in the playoffs; the Brewers are the second “worst,” by run differential; but, that simply proves that both clubs were prepared to win in uneven divisional environments and take advantage of a relatively mediocre league. While it is indisputable that the American League features some truly elite clubs, their clubs also feasted on some true bottom-feeders, which may explain the unbalanced terrain between the NL and AL playoff standings.
| 2018 AL | Wins | RS / RA (Park) | Overall |
|---|---|---|---|
| Astros | 103 | +93 / +160 | +253 (!!!) |
| Red Sox | 108 | +113 / +106 | +219 |
| Yankees | 100 | +88 / +84 | +172 |
| Cleveland | 91 | +55 / +105 | +160 |
| Athletics | 97 | +94 / +43 | +136 |
The good news for the Brewers is that while Colorado claims the very best pitcher in the playoffs in Kyle Freeland, Freeland just produced an excellent Wild Card performance that likely means he is out of commission until a potentially pivotal Game Three. Notably, four of the Top 10 pitchers in the MLB are not working during the playoffs, and only 12 of the Top 20 pitchers are working; Individual Runs Prevented performance is not everything to a team.
| Best Starters | Overall Rank | Average Runs Prevented |
|---|---|---|
| Kyle Freeland (COL) | 3 | 46 |
| Chris Sale (BOS) | 5 | 45 |
| Justin Verlander (HOU) | 7 | 43 |
| Trevor Bauer (CLE) | 8 | 42 |
| Corey Kluber (CLE) | 9 | 38 |
| Mike Clevinger (CLE) | 10 | 35 |
| Gerrit Cole (HOU) | 11 | 31 |
| Luis Severino (NYA) | 15 | 26 |
| Carlos Carrasco (CLE) | 19 | 23 |
| Mike Foltynewicz (ATL) | 20 | 23 |
While many have noted the Cubs perceived struggles over the last couple of weeks, perhaps Colorado’s biggest favor was knocking Chicago’s bullpen out of the playoffs. In terms of Average Runs Prevented, both the Rockies and the Brewers claim some of the best relievers in the postseason; yet, Chicago was the richest team of them all in terms of bulk of quality bullpen arms.
The Brewers have the very best reliever in the National League in Jeremy Jeffress. Although he has faded, Josh Hader remains a quality option, as he ably demonstrated during the Brewers’ bid to win the National League Central.
| Best Relievers | Overall Rank | Average Runs Prevented | |
|---|---|---|---|
| Blake Treinen (OAK) | 13 | 27 | |
| Jeremy Jeffress (MIL) | 16 | 25 | |
| Chad Green (NYA) | 28 | 18 | |
| Collin McHugh (HOU) | 30 | 18 | |
| Adam Ottavino (COL) | 34 | 17 | |
| Josh Hader (MIL) | 40 | 16 | |
| Steve Cishek (CHN) | 41 | 16 | |
| Scott Oberg (COL) | 47 | 15 | |
| Pedro Strop (CHN) | 51 | 15 | |
| Jesse Chavez (CHN) | 53 | 14 |
Notably, in terms of assessing current Runs Prevented against mid-September performance, both Colorado and Milwaukee are among the most improved pitching staffs in the MLB. Both teams are improving at the right time, which throws the series into doubt: Milwaukee may escape facing Freeland twice, depending on how the series unfolds, but the remaining Colorado rotation features some formidable arms. Yet, the same can be said of the Brewers’ quietly effective pitching staff: Jeffress, Hader, Wade Miley, Jhoulys Chacin, Corbin Burnes, and even new addition Gio Gonzalez finished within the Top 20 percent of MLB pitchers (by Runs Prevented); Chase Anderson just missed. With an improved Corey Knebel on the roster as well, Milwaukee’s bullpen is now deep enough with quality options to answer any questions about the rotation behind Miley, Chacin, and Gonzalez (spoiler alert: the rotation is fine).
So, that leaves one to question how the battles of these two bullpens will fare overall, and how the suddenly strong Brewers offense will perform against the most improved pitching staff from September.
It’s playoff time! Go Brewers!

