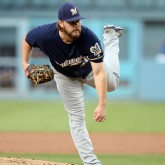
In 2018, MLB teams employed 799 distinct pitchers to fill 892 spots, which is quite a few hurlers. That’s an increase for 2017, when 754 distinct pitchers filled 839 roles. The 30,000 foot overview of this progression suggests that each MLB team had room for at least one additional pitcher in 2018 (it could have […]
Tag: MLB Runs Prevented
A Quick Note on LCS Aces
Based on Average Runs Prevented, the following pitchers are among the Top 20 percent of all starters in the 2018 MLB. This is a brief table demonstrating their overall League Championship Series performances to date: LCS “Aces” (Top 20% MLB SP) Average Runs Prevented LCS IP LCS RA RA9 Chris Sale – BOS 45 4.0 […]
Runs Prevented Rankings I
Over the last couple of months, some comments based on Runs Prevented have helped me to re-evaluate how I present the statistic on the website (and, by extension, on BPMilwaukee Twitter, where I publish the Brewers Daily Pythagorean (or Run Differential, RS / RA) record). Thus, in March I posted a basic explanation of how […]


