Most sabermetric analysis of pitchers revolves around three central statistics: strikeouts, walks, and fly balls (in relation to home runs). Hurlers who compile a healthy amount of the former while avoiding the latter two will see that reflected in their xFIP — considered by many the best statistic to evaluate a pitcher. This doesn’t fully illustrate a pitcher’s impact on the game, however, as many facets of his performance go unnoticed, attributed to random variation and swiftly dismissed as a fluke. Even if the pitcher’s play has legitimately caused those outcomes, this form of study ignores that.
Across 2013 and 2014, the Milwaukee Brewers experienced a fair amount of upheaval in their starting rotation. Yovani Gallardo, the club’s most consistent starter across the prior four seasons, took a step back in the past two and pitched to more mediocre results before heading to Texas in the offseason. Wily Peralta and Mike Fiers excelled in 2014, but encountered some speed bumps in the preceding year. A journey first to the bullpen, then to Toronto, awaited Marco Estrada for his struggles as a starter. In this time, only one pitcher posted consistently solid results for the Brewers: Kyle Lohse.
Lohse represented an interesting case. The first decade of his career had some ups (4.18 ERA in 2005, 3.78 ERA in 2008), as well as some downs (5.34 ERA in 2004, 5.86 ERA in 2006). For the period as a whole, he had a deserved reputation as a below-average, back-of-the-rotation starting pitcher. That changed in 2011, when he pitched his way to a 3.39 ERA in 188.1 innings for the Cardinals. He followed that up with a 2.86 ERA in 211.0 2012 innings, which earned him a three-year deal from the Brewers. Despite moving to a ballpark that heavily favored hitters, he managed to put up a 3.45 ERA in the 397.0 innings he accrued over the next two years.
In 2015, that has completely vanished. Lohse has a putrid 6.30 ERA through 85.0 innings, the second-worst mark in the National League. The one-time rock in Milwaukee’s rotation has become a burden, for which they’ll be lucky to receive anything at the trade deadline. What has happened to the 2011-2014 iteration of Lohse?
In those four years, Lohse struck out 15.9% of the batters he faced, and walked 4.9% of them. This season, he’s struck out 17.3% of the batters he’s faced, and walked 5.1% of them. Together with mostly-analogous batted-ball rates, this has given him a 2015 xFIP of 4.09 — in line with his 4.02 xFIP from the four seasons before it. By this simplistic metric, he hasn’t altered himself at all from previous seasons. So we’re done here, right? Poor fortune has worsened Lohse’s ERA, nothing more. Case closed!
Not quite. Lohse’s case is obviously more complex. His batting average on balls in play, strand rate, and home runs per fly ball have all notably worsened, and he’s accountable for each, to varying extents.
We’ll start with the first statistic, BABIP. From 2011 through 2014, Lohse compiled a .269 BABIP against him, the tenth-lowest rate in the majors. Come 2015, that’s jumped up to .302, a decidedly more average level. Because a rise in hard contact (from 31.7% to 35.4%) accompanied it, this change doesn’t look like a fluke. And based on Lohse’s pitch location, we can easily see the cause for this.
In those four successful campaigns, Lohse continually placed the ball low in the strike zone:
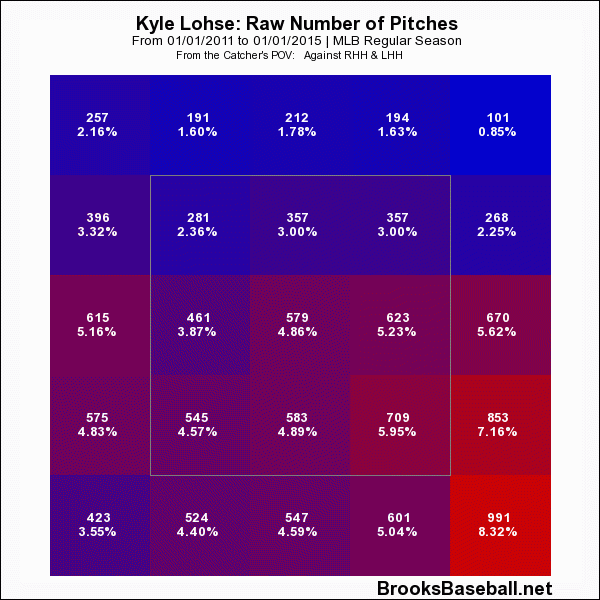
It might make sense, then, that he’d take that to the extreme in year five:
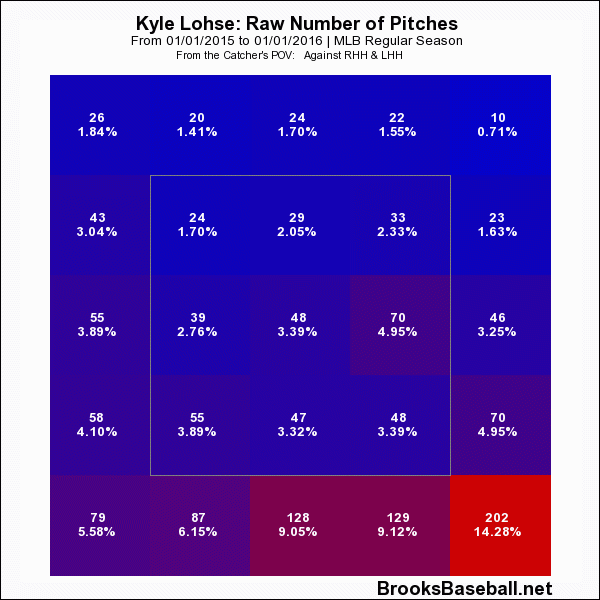
That approach has caused problems, though. In the aforementioned four-year span, hitters only managed a .241 BABIP off pitches in the lower fifth of the plate. This year, they’ve ratcheted that up to .319; since most of the balls in play against him have come in that section, this accounts for most of the rise in Lohse’s overall BABIP.
LOB% is always a volatile statistic, and this had served Lohse quite well in his good years, when he prevented 75.0% of runners on base from scoring. He’s since lost this skill, and has to this point stranded a mere 62.4% of runners. His splits do indicate that he’s done worse under pressure: Hitters had a .228/.298/.379 triple-slash against him with runners on from 2011 to 2014, but have hit .310/.354/.606 in those situations in 2015.
Messing with his success, Lohse has shifted his pitch mix in these situations:
| Year(s) | Fourseam | Sinker | Slider | Curve | Change |
|---|---|---|---|---|---|
| 2011-2014 | 3.7% | 43.2% | 28.3% | 6.9% | 18.0% |
| 2015 | 3.2% | 33.2% | 34.9% | 6.4% | 22.3% |
Before this year, the slider and changeup had dominated hitters; they’ve lost some of that bite, evidently:
| Year(s) | Changeup AVG | Changeup OBP | Changeup SLG | Slider AVG | Slider OBP | Slider SLG |
|---|---|---|---|---|---|---|
| 2011-2014 | .192 | .214 | .317 | .231 | .270 | .333 |
| 2015 | .253 | .284 | .398 | .230 | .280 | .420 |
This repertoire adjustment had a hand in Lohse’s strand rate decline. (In this area, luck actually did play a role — LOB% correlates extremely poorly year-to-year, and can often fluctuate wildly.)
And finally, we come to HR/FB%. Lohse’s figure there has nearly doubled, from 8.8% in the 2011-2014 span to 16.2% in 2015. Unsurprisingly, his peripheral statistics support such a change: The average fly ball distance against him has spiked from 283.6 feet to 293.7 feet. (As points of reference, Ruben Tejada has hit his fly balls an average of 283.6 feet this season, and Nelson Cruz has hit his fly balls an average of 293.4 feet this season. Yeah, that’s a bit of a gap.)
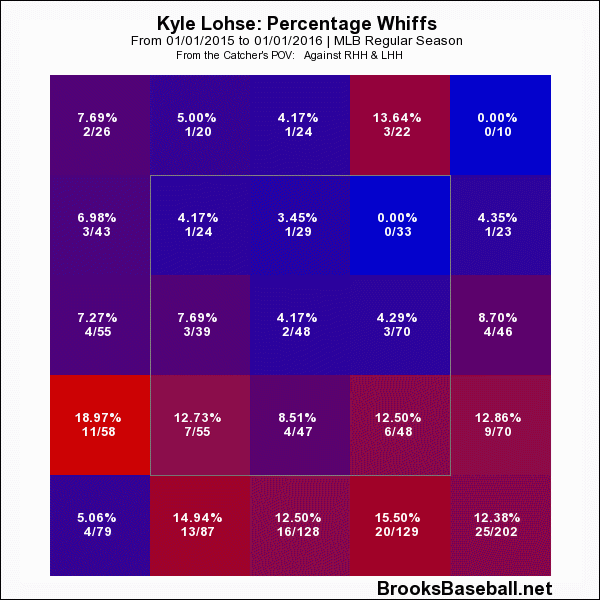
A trip to Lohse’s zone map elucidates the cause of this. Hitters have mostly knocked high pitches of his out of the park:
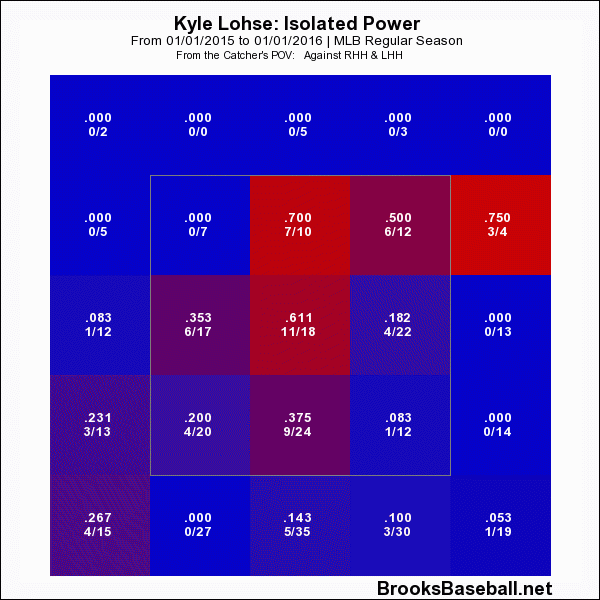
As mentioned earlier, Lohse has pounded the lower part of the zone this year. Perhaps because high pitches don’t come around as often, batters haven’t whiffed at as many of them:
And, on the swings where they’ve made contact, it’s generally gone airborne:
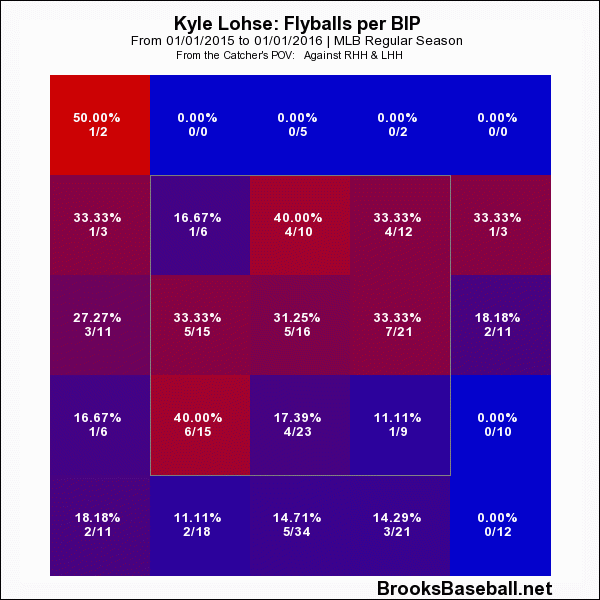
Like many pitchers who stay low in the strike zone, Lohse pays dearly for it when he strays high.
So, by looking at these statistics and discerning their causes, we can confirm the obvious: Lohse has pitched worse this year. xFIP wouldn’t tell us that, nor would any of its defense-independent counterparts. By contrast, DRA appraises his output thus far as much worse than in other seasons — his 4.84 2015 DRA is more than a run above his average from 2011 to 2014. As far as advanced pitching metrics go, this one takes the cake in its descriptive power, and its ability to save me a thousand words of analysis.
Looking solely at three statistics of a pitcher, while casually throwing out the rest, does him a disservice. The men on the mound have far more control over the results they put up than some within the statistical community have traditionally given them credit for, and in the case of someone like Lohse, he probably wishes that weren’t so.
2 comments on “Kyle Lohse and The Limits of DIPS”