On Monday, I looked at which Brewers position players can be labeled as injury-prone. Today, I’ll move on to determine which pitchers on the Brewers can be labeled as injury-prone, and a little more. While injuries definitely suck, pitcher injuries are the worst – especially if it’s an elbow or shoulder injury, as those can be career-threatening. They can cause a pitcher to miss an entire season, and due to an increase in Tommy John surgeries, this seems to be happening all too often.
That being said, the Brewers have not had to deal with a ton of pitcher injuries this year. The only real significant injury to the pitching staff has been to Wily Peralta. He went down on May 5th with a strained left oblique and has yet to return to the lineup. Matt Garza was placed on the 15-day disabled list on Monday with right shoulder tendinitis, but according to this article from the Milwaukee Journal Sentinel, it looks like it’s nothing too serious. The right-hander should only miss one start. According to Garza, he’s been pitching with this injury for some time (the article didn’t specify when the injury occurred). If he’s been pitching through shoulder tendinitis for most of the season, it could conceivably explain some of his struggles. As for Peralta, he reportedly has thrown a successful bullpen session.
#Brewers RHP Wily Peralta threw first bullpen today since going on DL with oblique. Said went well.
— Tom (@Haudricourt) June 29, 2015
Therefore, the Brewers may shortly get him back into the rotation, probably sometime after the All-Star Break.
The Peralta injury also opened the door for Taylor Jungmann, who has been effective since making his debut. While his 2.43 ERA is excellent, he does own a 3.54 FIP, which is roughly league-average. It should be noted, though, that his 3.00 DRA (Deserved Run Average) is above-average. I would expect Jungmann to experience some regression in the second half — but remain an above-average pitcher — and that’s definitely a nice discovery for the Brewers, considering their starting-rotation woes.
Considering these factors, it seems safe to say that the Brewers pitching staff has not overly been affected by pitching injuries in 2015. At least not up to this point. This, however, has not always been the case. Look at the 2008 season. In that year, Brewers pitchers missed 624 days due to injury. The injuries also impacted significant players, as Yovani Gallardo and Chris Capuano missed more than 200 days. Gallardo suffered two major injuries, to his knees, that year. The most significant one was the first knee injury, which was a torn ACL that caused him to miss 144 days. Chris Capuano on the other hand, had Tommy John surgery, which shelved him for the entire season. It went on to affect the rest of his time with the Brewers.
Throughout their time with the Brewers, both players were plagued with injuries, but again, do they deserve the label of being injury-prone? The methodology I used is the same as the one I outlined on Monday — read about it here. With that said, the data shown below is from 2004 to 2014.
| First | Last | Injuries | Days missed | IP | Years with Brewers |
|---|---|---|---|---|---|
| Chris | Capuano | 4 | 309 | 744.6 | 2004-2010 |
| David | Riske | 3 | 307 | 66.6 | 2008-2010 |
| Manny | Parra | 4 | 260 | 513 | 2007-2012 |
| Chris | Narveson | 6 | 256 | 387.4 | 2009-2013 |
| Yovani | Gallardo | 5 | 239 | 1289.3 | 2007-2014 |
| Brandon | Kintzler | 3 | 224 | 174 | 2010-2014 |
| Marco | Estrada | 3 | 218 | 521 | 2010-2015 |
| Ben | Sheets | 7 | 210 | 839.3 | 2004-2008 |
| Vince | Perkins | 1 | 172 | 2007* | |
| Jim | Henderson | 2 | 164 | 102 | 2012-2014 |
| LaTroy | Hawkins | 3 | 161 | 64.3 | 2010-2011 |
| Mitch | Stetter | 1 | 161 | 86 | 2007-2011 |
| Mark | Rogers | 1 | 158 | 49 | 2010, 2012 |
| Tyler | Thornburg | 1 | 149 | 118.4 | 2012-2014 |
| Doug | Davis | 3 | 138 | 671.6 | 2004-2006, 2010 |
| Tom | Gorzelanny | 4 | 119 | 106.3 | 2013-2014 |
| Randy | Choate | 1 | 112 | 2008* | |
| Matt | Wise | 2 | 92 | 215 | 2004-2007 |
| Takashi | Saito | 2 | 90 | 26.7 | 2011 |
| Shaun | Marcum | 4 | 85 | 324.7 | 2011-2012 |
| Elmer | Dessens | 1 | 68 | 15 | 2007 |
| Tomo | Ohka | 1 | 66 | 223.3 | 2005, 2006 |
| Dave | Bush | 1 | 65 | 869.9 | 2006-2010 |
| Rick | Helling | 1 | 65 | 84 | 2005-2006 |
| Mark | DiFelice | 2 | 59 | 73.7 | 2008-2011 |
| Zack | Greinke | 1 | 59 | 294.7 | 2011, 2012 |
| Jeff | Suppan | 3 | 59 | 577.1 | 2007-2010 |
| Seth | McClung | 1 | 56 | 179.3 | 2007-2009 |
| Wei-Chung | Wang | 1 | 54 | 17.3 | 2014 |
| Jorge | De La Rosa | 2 | 50 | 95.3 | 2004-2005, 2006 |
| Ben | Ford | 1 | 43 | 24 | 2004 |
| Julio | Santana | 1 | 40 | 42 | 2005 |
| Eric | Gagne | 1 | 39 | 46.3 | 2008 |
| Hiram | Burgos | 1 | 35 | 29.3 | 2013 |
| Matt | Garza | 2 | 34 | 163.3 | 2014-2015 |
| Josh | Butler | 1 | 32 | 4 | 2009 |
| Greg | Aquino | 1 | 30 | 14 | 2007 |
| Alfredo | Figaro | 1 | 29 | 82.7 | 2013-2014 |
| Trevor | Hoffman | 1 | 27 | 101.3 | 2009-2010 |
| Todd | Coffey | 1 | 20 | 153.3 | 2008-2010 |
| Jesus | Colome | 2 | 16 | 6.3 | 2009 |
| Jose | Capellan | 1 | 12 | 99.4 | 2005-2006, 2007 |
| Claudio | Vargas | 1 | 12 | 184.3 | 2007, 2009-2010 |
| Wily | Peralta | 2 | 8 | 411 | 2012-2015 |
| Kyle | Lohse | 2 | 6 | 397 | 2013-2015 |
| Sergio | Mitre | 1 | 6 | 33 | 2011 |
| Dan | Kolb | 1 | 5 | 105.6 | 2004, 2006 |
| Jimmy | Nelson | 1 | 4 | 79.3 | 2013-2014 |
| Randy | Wolf | 1 | 3 | 354.6 | 2010-2011, 2012 |
| Will | Smith | 1 | 2 | 65.7 | 2014-2015 |
| Chris | Smith | 1 | 2 | 49.3 | 2009-2010 |
| John | Axford | 1 | 1 | 263.4 | 2009-2013 |
| Average | 1.9 | 89.05 | 228.75 | ||
| Sum | 100 | 4631 | 11437.9 |
* Injury happened in the minors.
Both Vince Perkins and Randy Choate’s injuries happened while they were in the minors. They never threw a single inning with the Brewers, which is why there’s nothing in their innings-pitched column.
At first glance, Gallardo definitely seems like a player who was hampered by a lot of injuries, and he has. He has the fifth-most days missed due to injury since 2004, and he ranks third in the number of separate injuries he suffered during that time compared to other Brewers players. While that is true, he also pitched many more innings than any other Brewers pitcher on the list. Therefore, labeling him as “injury-prone” may be misguided. Chris Capuano and David Riske, I would argue, are players who better fit that profile. Here is a visualization that should aid my argument.
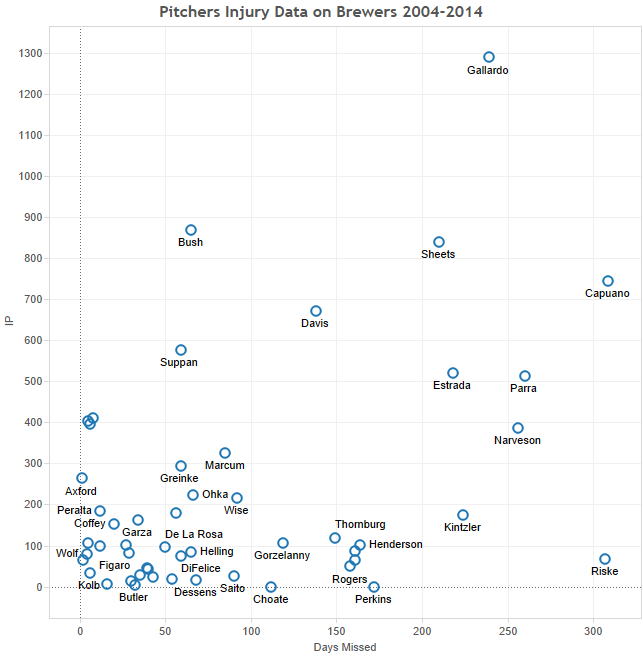
The data here is a lot less clustered than the one with position players. It’s harder to find outliers or players who fit the profile of injury-prone. The one obvious case, though, is of David Riske. He barely pitched for the Brewers, and yet since 2004, he has missed the second-most games. His career took a nosedive when he suffered Tommy John surgery in 2009. He attempted a comeback in 2010, pitching a total of 23.1 innings that year and posting a 5.01 ERA. That proved to be the last year he pitched in the big leagues. This is just another reminder that not every pitcher, after having Tommy John surgery, makes it back or finds success. It is a massive surgery and has ended the career of many pitchers, including Riske. It also seriously affected the career of Chris Capuano, who after suffering his second Tommy John surgery in 2008 didn’t pitch again in the bigs until 2010. While the surgery didn’t end his major-league career, it was a major cause for his end in Milwaukee. In 2010, he only pitched 66 innings for the Brewers. He then isigned with the Mets the following offseason.
PITCHERS VS. POSITION PLAYERS
The other part of all this that I found interesting was that while the position players suffered more injuries, on average, the pitchers missed many more games.
| Average | Sum | |||
|---|---|---|---|---|
| Injuries | Days | Injuries | Days | |
| Pitchers | 1.9 | 89.05 | 100 | 4631 |
| Position players | 3.7 | 68.57 | 194 | 3566 |
While, this certainly isn’t a league-wide study and simply a look at the Brewers, it wouldn’t surprise me if this were the norm for the rest of the league. Position players probably have to deal with more nagging injuries, while with pitchers when something breaks, it’s more serious.
THE DIFFERENCE
The table above, on the other hand, is an overall look at the data from 2004 until 2014. Let’s look at the difference in days missed between Brewers position players and pitchers for each individual year.
| Year | Pitchers | Hitters | Difference |
|---|---|---|---|
| 2014 | 483 | 174 | 309 |
| 2013 | 446 | 872 | -426 |
| 2012 | 338 | 481 | -143 |
| 2011 | 751 | 217 | 534 |
| 2010 | 548 | 387 | 161 |
| 2009 | 464 | 250 | 214 |
| 2008 | 624 | 122 | 502 |
| 2007 | 167 | 347 | -180 |
| 2006 | 537 | 424 | 113 |
| 2005 | 138 | 132 | 6 |
| 2004 | 135 | 160 | -25 |
| Total | 4631 | 3566 | 1065 |
The biggest difference obviously came in 2011. That year Manny Parra, Brandon Kintzler, and Mitch Stetter all basically missed the entire season due to injury. Kintzler only pitched 14.2 innings, Stetter pitched even fewer innings, and Parra missed the entire season. These injuries, though, were to three relief pitchers and didn’t end up hampering the team all that much — especially considering the fact that the Brewers finished first in their division that year.
What some, however, might find most surprising is that in 2013, 2012, 2007, and 2004, position players had more injuries than pitchers. While this is probably not the norm, this can, and does, happen. In 2013, for example, the Yankees pitchers only missed 350 days, while their position players missed 1170 days due to injury, according to Jeff Zimmerman. In that same article, he also shows the top-ten differences in days missed between position players and pitchers from the data he recorded.
CONCLUSION
Obviously, what I’ve done here isn’t a scientific study. I have mostly provided data, in an effort to give us a better sense of which Brewers players can be labeled as injury-prone, although the argument is mostly anecdotal. I would also be interested in seeing how this data relates to the rest of the league. The Brewers, for example, are well-known for having far fewer Tommy John surgeries than other teams in the majors. Today, though, I wasn’t able to provide that. Accumulating this type of information takes a lot of time, so providing better context will have to wait for a later date.
What I hope this has done is not necessarily answer all questions, but also raise new ones for both Brewers fans and general baseball fans.