“Bill James defined sabermetrics as ‘the search for objective knowledge about baseball.'”
*****
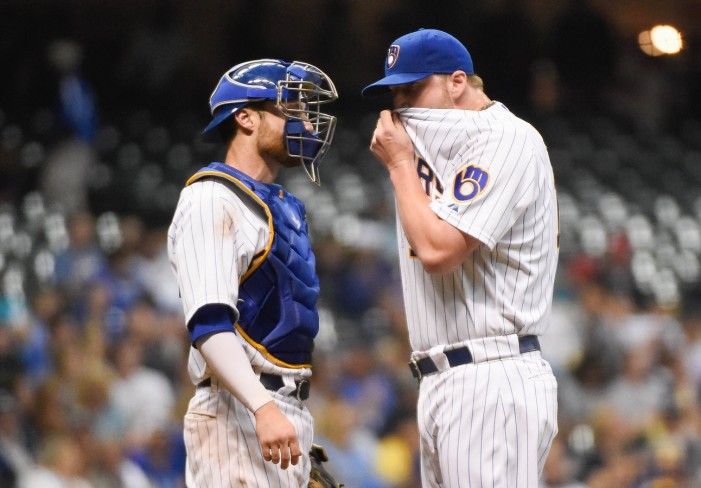
One of the major topics discussed on this site has been the Brewers bullpen. It has been discussed in depth and at length since BP Milwaukee first launched. While the Brewers had an awful season, the one bright spot was the relief corps. It was a way to focus on the positives of the season.
The interesting part is that evaluation of the bullpen has recently been a big topic in baseball. It started a few years ago when the Oakland A’s traded for Jim Johnson. Most people, including myself, thought they were nuts, the belief being it was a huge overpay, especially for the A’s who took on all of the 10 million dollars remaining on the deal. The strangest part was that this was the A’s; they were supposed to be one of the “smart” teams. Common sabermetrics orthodox suggests that spending money on closers and relievers is a bad idea.
Then last season, the Astros signed Luke Gregerson and Pat Neshek. This season, the Red Sox traded two top-100 prospects for Craig Kimbrel, while the Astros traded a number of talented prospects (including the former number-one-overall pick, Mark Appel) for closer Ken Giles. The A’s also signed Ryan Madison to a three-year deal.
So what gives? All of these teams are highly regarded in the sabermetric sphere. Why are they the ones making these types of deals? If they would’ve been made by different teams, they would have been heavily mocked.
Perhaps we’ve been undervaluing relievers all along. Interestingly enough, the Lord Commander of this website J.P. Breen wrote an article about this very notion entitled “Contention & Building Through the Bullpen” back in August. In the article, Breen discussed the notion of market inefficiency in baseball, pondering what would be the next inefficiency to bubble to the surface. He eventually landed on the use of the bullpen. But his point was that teams were not looking to uncover it. Teams had already uncovered it. The revolution was already underway.
Breen had already seen the trend, that teams were utilizing the shutdown bullpens to, “effectively compensate mediocre or below-average starting rotations.” With the combination of the Royals super bullpen, the Yankees addition of Andrew Miller, the Orioles pair of super relievers (Zach Britton and Darren O’Day), and even the Blue Jays young reliever core, those teams were able to mitigate subpar starting rotations with quality bullpens.
His main point was that the Brewers should take note of this during their rebuild. The fact that contracts for relievers still seem cheap means the Brewers should be able to buy quality relief pitching when the time is right. More importantly, the Brewers now have a healthy farm system. They should be able to use their new and improved system to fill in these important holes in the bullpen. What is especially encouraging, as Breen mentioned, is the Brewers currently have useful bullpen pieces.
These pitchers can be used in a number of ways. They can by used as building blocks or trade pieces. If the Brewers feel as though they can get a high return for one of their relievers, they should definitely make a move and look to acquire more prospects. But, while I’ve mentioned that the Brewers bullpen has been good and while it’s been discussed a number of times on the site, the question still remains: just how good was the Brewers bullpen in 2015?
A few months ago, I would have probably simply looked at one of the WAR metrics to get an idea of the situation. But, as Russell Carleton mentioned in his article, “The Kimbrel Gambit,” WAR may not be the best way to measure or look at relievers: “WAR, by its very nature, seeks to strip out the context out of a player’s results, although the major WAR indices are all aware that for relievers, that’s a little silly. In general, we find that in WAR for relievers, there is an adjustment made so that a pitcher’s WAR is inflated by a factor that is halfway between 1.00 (average leverage) and the average leverage that he faced in the games that he threw. If he normally faced a leverage value of 2.00, his WAR (for his pitching components) would be inflated by a factor of 1.5. The problem here is that while closers do pitch in 40-50 save situations each year, they also pitch in games where they are just getting work in or are filling an inning. (Here’s Kimbrel’s game log for last season. There are a few decidedly non-save situations.) Those ‘extra’ innings aren’t really what teams are paying closers for, and they are generally low-leverage, but they mean that the pitcher’s ‘average’ leverage will decrease. In other words, WAR under-values closers, even with its adjustment and here I don’t think it’s a good metric for what we really want to measure.” Russell concluded in that article that Win Probability Added (WPA) was a better way of looking at relievers. I would agree with this to a certain extent.
In August, I engaged in an exercise and asked the question of who was the Brewers true closer? I made a couple of conclusions. One was that we can take the term closer literally and define closer as someone who “closes” games. The other point was that we can look at closers through the lens of clutch. I defined clutch as the pitcher who pitched the highest leverage innings because that’s the point of the closer mentality. It’s the ability to pitch in high-leverage situations. The point is not that closers are getting paid for saves. Maybe they are, in part, but I think teams are smart enough to recognize that the save is a silly stat. What closers are really being paid for is getting outs in high-leverage situations. That success can, therefore, be looked at through WPA.
Win Probability Added may sound complicated but it’s not. What it does is it “credits or debits” a player based on how his performance affects the probability of winning a game. If a relief pitcher comes in with the bases loaded and one out and gets out of the jam, that has more value than a pitcher who came in and got two outs with nobody on. The problem is that most pitching metrics won’t take that context into consideration. This, to a certain extent, is fine for a starter or a position player, but for a relief pitcher it’s not. This is primarily because so much of his role revolves around the ability to get outs in clutch or high-leverage situations.
So now, let’s look at how the Brewers 2015 bullpen ranks throughout their history with WPA. (I went back to 1974 because that’s as far back as the results go.)
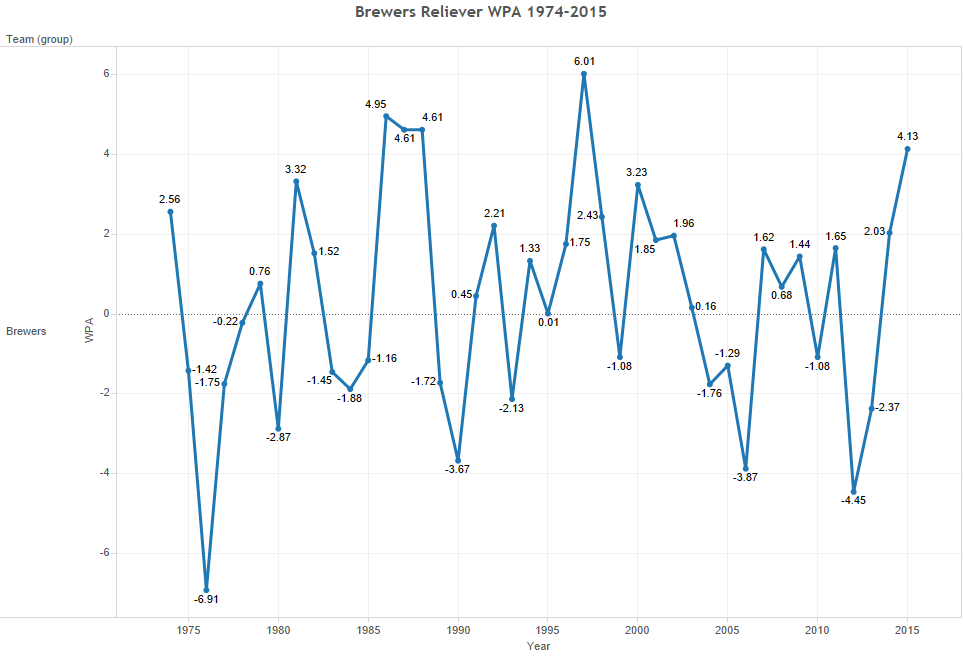
With WPA, the Brewers 2015 season was the fifth-best in franchise history. It also ranked seventh among all Major League teams for the 2015 season. Even though the team would have probably ranked higher by other metrics, it’s still a welcome sight to see the Brewers bullpen this high in the rankings after a number of years of poor bullpen performance.
Another way to look at this information is to analyze how the team ranks every year, compared to the rest of the league. While the fifth-best WPA in franchise history is good, in some years the Brewers reliever WPA might have ranked higher as compared to the rest of the league, even though their overall reliever WPA was lower.
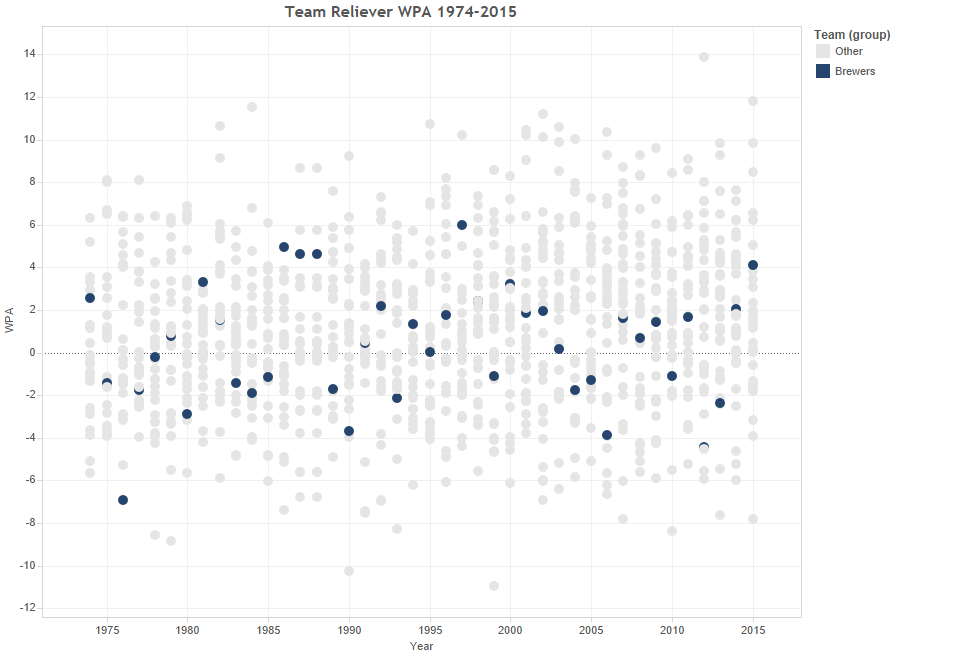
With this ranking, the Brewers 2015 season ranks seventh in its history. While in 1974 and in 1981 the Brewers reliever WPA was lower, they ranked higher compared to the rest of the league. In 1981, the Brewers had the highest reliever WPA in all of baseball. (They also ranked 235th out of 1168 teams in reliever WPA since 1974.)
I, obviously, am not the first to look at WPA. Russell Carleton as mentioned before has already noted that WPA is a good way of judging relievers. Jeff Sullivan of FanGraphs has also used this tool. In his article, he noted that the Pirates have beaten their projections the last couple of years while having a high WPA. He noted that the bullpen was a primary factor in beating the projections.
My next question then was this: Is there a relationship between WPA and beating projections? I, therefore, looked at old PECOTA projections dating back to 2008. From there, I looked at the difference in the preseason projections and the actual end of year wins, and how the WPA ranked within those differences. Due to the issue of small sample sizes, I had to split the variables into different buckets. So I put teams who beat their projections from 0-to-5 wins in the same bucket and looked at the average WPA within that bucket. I mainly created buckets of five, with some exceptions due to sample size issues.
| Diff in Projected Wins | WPA | Count |
|---|---|---|
| -15 to -26 | -2.65 | 15 |
| -10 to -15 | -1.57 | 26 |
| -5 to -10 | -0.44 | 29 |
| 0 to -5 | 1.5 | 48 |
| 0 (no Diff) | 1.7 | 8 |
| 0 to 5 | 2.7 | 34 |
| 5 to 10 | 3.3 | 36 |
| 10 to 15 | 3.8 | 31 |
| 15 to 23 | 6.6 | 13 |
I’m sure you can tell that these aren’t the best sample sizes, but they’ll have to do for now. With that caveat, there is a positive relationship between beating projections and WPA. Basically, the more a team outperforms its projections, the better the team reliever WPA was. The more the team underperformed its projections, the worse the WPA. This doesn’t mean that the bullpen was the sole cause of the effect on the difference in projections and actual wins. It merely means that it was probably a factor in it.
On the whole, 114 teams have beaten their projections and those teams averaged a WPA of 3.56. For the counterpart, 118 teams performed worse than their projections and averaged a WPA of -0.15. For the ones who equaled their projections, well, that you can tell from the table above. It’s the one with zero difference.
Beating projections aren’t easy, but teams who have a better bullpen seem to have a better chance of accomplishing that goal.
While WPA is a good stat for judging relievers, it’s not perfect. The biggest problem with WPA is it’s highly dependent on how a manager uses a reliever. If a manager has a misconception about a specific relievers skill set, then it is unlikely that that reliever will be used in high-leverage situations. Closers will naturally get the highest-leverage situation, simply from the virtue of pitching in the ninth inning.
Take Jeremy Jeffress, for instance (I know he’s not a “closer” but it’s the same principle). His WPA was 1.66, meaning that he performed successfully when one takes the context of the game in consideration. While someone like Michael Blazek has a 0.13 WPA even though he performed just as well and even times better than Jeffress in other context neutral metrics. The difference was that Jeffress had more opportunities to pitch in high leverage situations then Blazek.
Looking at gmLI (A pitcher’s average LI when he enters the game), Jeffress has a 1.35 gmLI while Blazek had a 0.66 gmLI. Jeffress also had a 1.44 pLI (A player’s average LI for all game events), while Blazek had a 0.58 pLI. Jeffress, therefore, had many more opportunities to pitch in high-leverage innings. The problem here is determining which one had the better season. I’m still unsure of the answer here. On the one hand, Jeffress’ pitched well in the leverage situations he was put in. On the other hand, Blazek performed well but simply didn’t get the same opportunities.
For teams, the answer is still the same, it’s not about what a pitcher did in the past, but what a pitcher will do projecting forward. When it comes to relievers, teams may then still be able to find bargains by getting pitchers who haven’t pitched in many high-leverage situations, and who performed well even without the context. Those pitchers might be undervalued by their current teams, and if the Brewers stay vigilant, they might be able to us it as an advantage.
Whatever the goal may be, having a strong and quality bullpen is a very real asset. As Carleton mentioned, it can add more than a couple of win’s worth of value, and as Breen has pointed out, it seems that teams are in the know when it comes to this effect. This is no longer the next market inefficiency but now a real strategy in baseball.
It seems many in the media believe sabermetrics to be static. This is simply not the case. It’s actually quite the opposite. Sabermetrics, as Bill James once said, is the “search” or the pursuit towards objectivity. The key word being pursuit. Sabermetrics is always evolving and trying to find better objective ways of making the best decisions. Now, objectivity is a rather complicated concept. Some believe that it is impossible to be completely objective and that very well might be true. But, that is why sabermetrics is pursuing that objective truth.
The point for the Brewers is not to remain static. To keep searching for that next “market inefficiency.” If they want to compete with the likes of the Cubs, Pirates, and Cardinals, they will need to keep an open mind on all things. The bullpen is currently a strength or, at least, was a strength. Building through the bullpen is a smart idea. They currently have the assets for the bullpen to be a strength, but considering the fact that relievers are so volatile, it may be better to move them this winter. (Maybe not someone like Will Smith who cFIP really likes and could have even more value once he’s given more of a chance in high-leverage situations next year). If the Brewers are able to get more quality young players for their relievers, then it might be well worth it.
There isn’t a perfect transition from starter to top-notch reliever. But, most relievers have flaws. Most of them only have two pitches. Some of them have command problems. For the Brewers, the next step will be to identify the best young pitchers who can’t stick it as a starter and put them in the bullpen. Don’t try and force anything. Put the players where they belong and allow them to strive in that role.
Much is made of the next market inefficiency. The true market inefficiency is having a smart and open mind. It is constantly pursuing that objective truth, even if you never reach it.
Thanks to Rob McQuown for research assistance.
Another good article, Julien. I like the notion of teams looking for efficient ways to improve one component of their roster as an indirect means of compensating for a weakness elsewhere. I’ve been looking at that in the context of the Tigers’ bullpen for a couple seasons now (e.g., https://aldland.wordpress.com/2015/07/10/window-shopping-pigs-in-the-pen/), and I think it’s a simple but very important idea.
On the reliever WPA/projection discussion, I wonder if it’s as simple as the projections simply failing to consider reliever WPA– a non sequitur of sorts– rather than something to do with a correlation connection. In other words, if PECOTA projections included reliever WPA (I’m assuming they don’t), the positive relationship you find between teams beating their PECOTA projections and WPA might not exist. (Perhaps the fact that that relationship does exist, together with the more substantive arguments Carleton and Sullivan highlight, suggests that PECOTA and other projections ought to be using WPA to judge relievers.)
Thanks for the comment AD. I don’t think it’s as simple as simply inserting WPA. I contacted the stats team and PECOTA does take into account context-dependant stats (all projections systems do) for WARP. That being said, BP does not use the leverage system. One reason is, “a lot of random effects end up getting applied as something other than random by people utilizing ‘leverage'”. Some context-dependant stats have also actually been removed this year in the WARP projections.