We are here. It’s the 2016 MLB draft. A number of scouts and experts will sit down and attempt to analyze the draft. Declaring whether this is a good pick or not. As avid baseball fans, a number of us will watch in anticipation of the results and which shiny new toy our favorite team has added.
Yes, the draft is an exciting time and there are a number of new and strange elements of the game we can learn about. For example, where are our favorite players drafted? We don’t often think about the draft on a geographical aspect, but it does play a serious factor. As research has shown, more players get drafted out of California, Texas, and Florida than most other regions.
I was, therefore, curious to see whether this was also true for the Brewers. Where do they make most of their draft picks? In order to answer this question, I gathered draft data from baseball-reference which has every state and every city that a player was drafted from. This includes all picks, even the players that didn’t sign with the team.
The Brewers aren’t a unique snowflake. Most of their players are drafted from California, Florida, and Texas.
Last year I also looked at a number of Brewers trends in the draft. Not only did I find that they were drafting more college players than usual, but I found that overwhelmingly, the Brewers were drafting more right-handed pitchers and that this selection was trending up. I, therefore, was interested to see if the Brewers prioritized a certain state for pitchers as oppose to position players. (This also contains some Canadian Provinces)
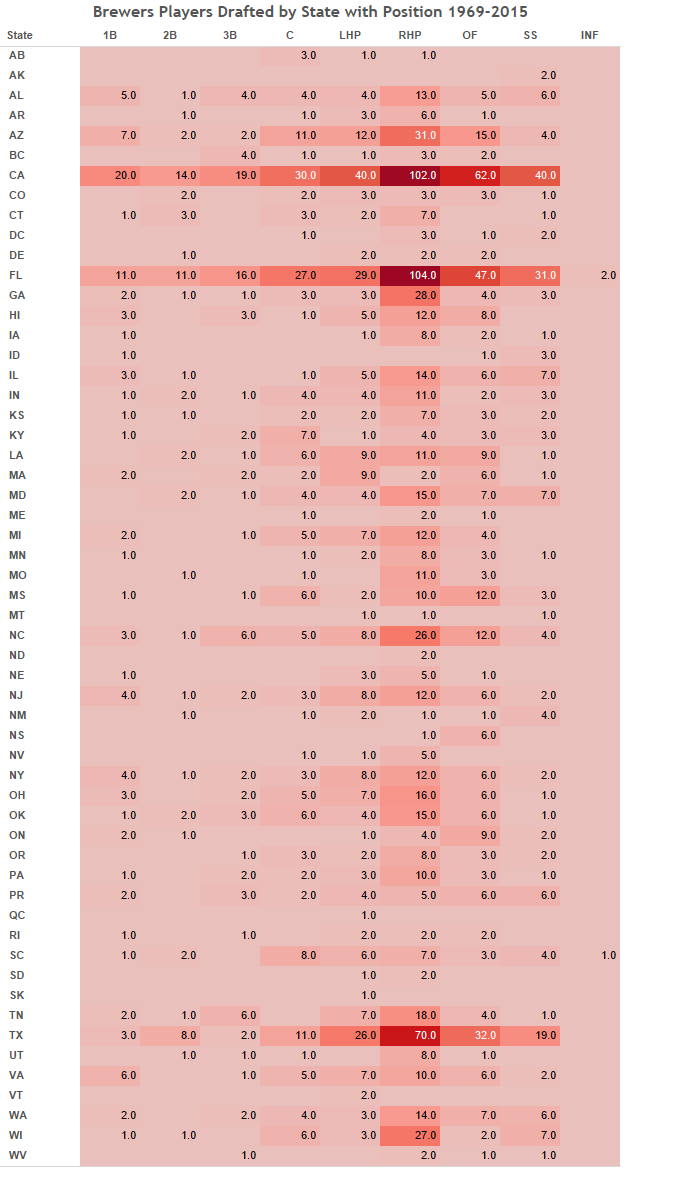
To put it bluntly, it doesn’t matter what state it is, the Brewers are more often than not going to pick starting pitchers. Of course, there are some exceptions, but most of them aren’t states where many players are drafted from. The only state where you could arguably make the case that the Brewers are targeting another position other than right-handed pitcher is Mississippi where more outfielders are drafted, but even then they’ve drafted 12 outfielders compared to 10 right handed pitchers.
It’s clear as night and day that the Brewers prioritize pitching in the draft. This may stem from the theory that pitchers are more volatile, and more prone to injury, therefore it’s better to have more of them. Most pitchers are also right-handed which is why you see more right handers than left handers. There’s also more pitchers generally on a major league roster. Usually, teams carry around 12 pitchers, which is obviously more than any other position. After all, at most teams will carry two catchers at the major league level.
But these results only give us a sense of the geographical demographic of the Brewers draft. I also looked at it by city to get a better idea.
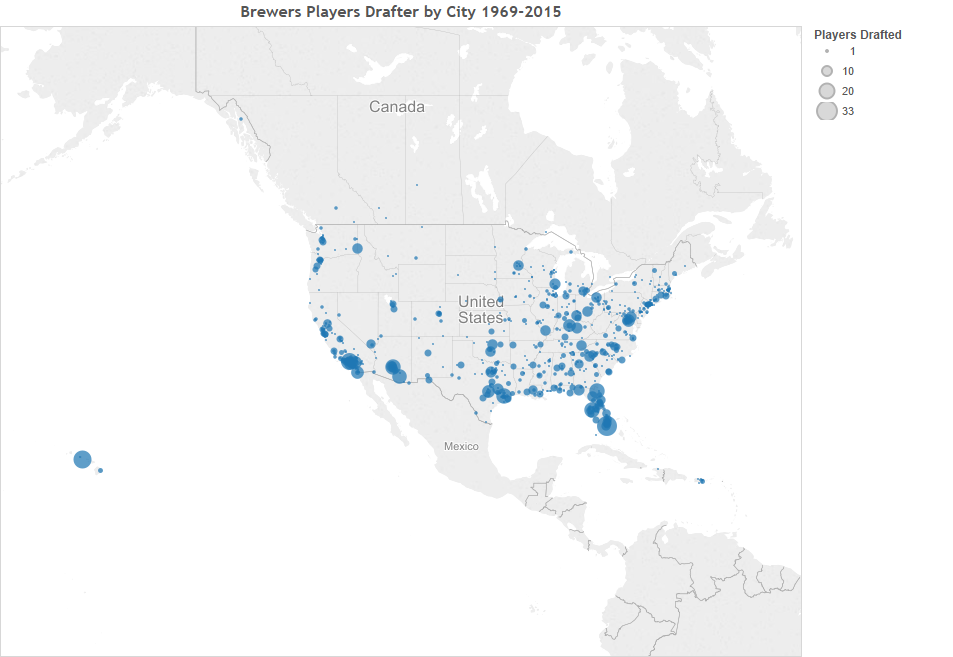
This better demonstrates the geographical demographic. Mainly, the Brewers focus a lot more on the southeastern side of the country, while the northwestern side is basically ignored. I mean just look at Wyoming. Since 1969, 46 years of drafting players, the Brewers have never drafted a single player from that state, which is incredible. There’s a pretty clear emphasis of concentration in the southeast. The reason for it is probably because that’s where the better baseball schools are located.
The Brewers, however, aren’t all that different from the rest of the league. Daniel Meyer of Beyond the Box Score looked into the geographic bias in the amateur draft. Basically, he found that most players get drafted from the southeastern side of the United States, which is also similar to the Brewers. Meyer also analyzed where most teams were sending their scouts, and how they could send them more efficiently, “The map shows that the southeastern U.S., Houston area, and the outskirts of southern California appear to be relatively ‘under’ scouted. On the other hand, Dallas, Phoenix, northern California and several areas throughout the northern U.S. appear to be relatively ‘over’ scouted”. This doesn’t mean that the Brewers are allocating their scouts inefficiently. It just means that as a whole, baseball could do a better job. Now, obviously, some teams are probably better than others which is why more research may be needed in this department.
One of the more interesting data points of this map is the city of Honolulu, which generated the second-most drafted players for the Brewers. The city with the most is Miami. Hawaii as a state has only had 32 players drafted, and Honolulu accounts for 27 of them. Again, further research is needed, but considering the geographical locations of the MLB draft, it wouldn’t surprise me to find out that Milwaukee is unique in that respect.
At the end of the day, this is just another reminder that the draft is a complicated and rich process. Even with all the new advancements in research and technology it still amazes me just how bad we truly are at getting it right. Maybe we will never get it right, and maybe we will. I don’t know, but the draft process, while being complicated, still remains one of the more interesting and multifaceted aspects of baseball.
1 comment on “The Geography of the Brewers Drafts”