The MLB Draft is a complicated and inexact science. Predicting it can be an even harder process. That’s why so often we look and find that mock drafts aren’t great predictive tools, and perhaps that’s not even the purpose of mock drafts. On the FanGraphs podcast, Kiley McDaniel mentioned, “… the mock draft is more of an avenue to spread information rather than necessarily to get the picks right.” So while mock drafts are fun to read and one can get a sense of which players a team is eyeballing, they primarily serve as an vehicle for dishing out information on players and overall strategy. Also, most mock drafts only address the first round. When one takes into account the later picks, it’s really just a crapshoot. So while I enjoy reading and looking at mock drafts, I don’t use them as predictive tools.
To be clear, what follows will not aim to predict future drafts or future Brewers’ drafts. The goal will mostly be to analyze the Brewers’ draft trends in order to make sense of their 2015 draft.
In case you forgot, the draft happened on June 8th. The Brewers had the 15th-overall pick and selected Trent Clark, a prep outfielder from Richland High School in Texas. Baseball America had Clark going 12th overall, Baseball Prospectus projected him to go 13th overall, and FanGraphs had him being taken fourth by the Rangers. This isn’t to criticize the mock drafts, but rather to suggest that the Brewers picked someone who was thought to be out of their reach. For the most part, all the analysis seems to indicate that this was a good pick, or at least a tremendous value pick. But this wasn’t the Brewers only pick in the 2015 MLB draft. In total, the Brewers drafted 41 players — 31.7 percent of whom were high school picks and 68.29 percent of whom were college picks.
Seems like they went college heavy, right? Since 1968, 46 percent of the players drafted by the Brewers have come from high school (54 percent college or junior college). But before making any steadfast claims, let’s look at the Brewers overall draft trends comparing high school and college players.
Important Note: The data gathered on the draft came from Baseball-Reference, which also includes players who have not signed; it contains all draft picks.
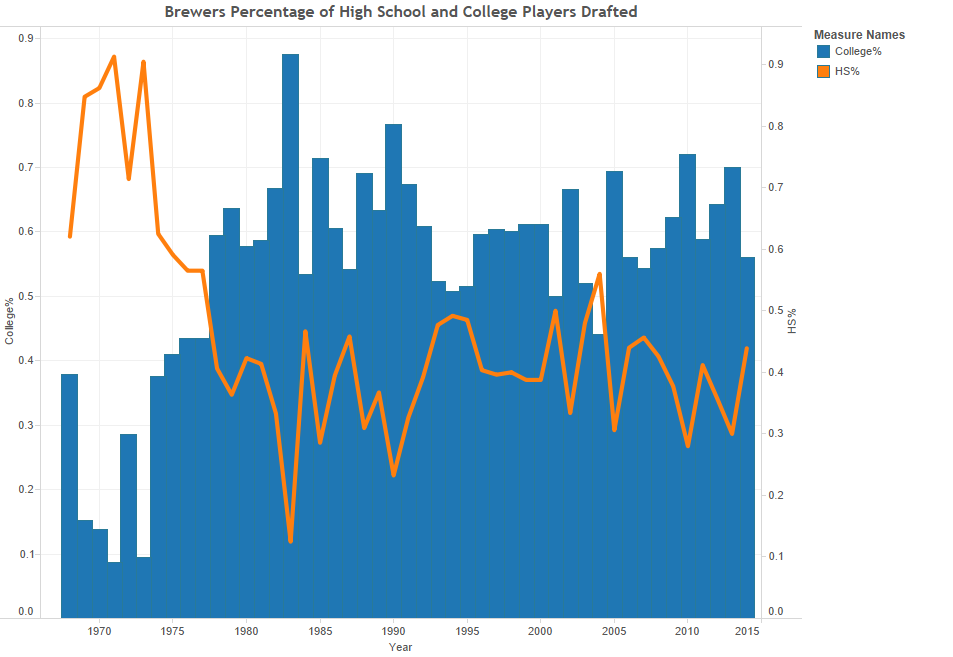
As you can see, earlier in the organization’s existence, the Brewers predominantly drafted high school players. This was not uncommon during that time, as most players who were drafted came out of high school. After 1977, though, the only year in which the Brewers drafted more high school than college players was 2004, when 56 percent of their picks were high schoolers. The Brewers especially went college-heavy in the 1980s. What is odd, however, is that in the early 2000s, when Moneyball came out, the Brewers began drafting a lot more high school players. This was unusual because, as displayed by Ben Lindbergh in his article “Get ‘Em Young, Get ‘Em Throwing: How Two Recent MLB Draft Trends Can Help Us Anticipate This Year’s Results,” the early 2000s produced an all-time low number of high school players drafted. The conventional wisdom during that era was that college players represented a safer bet, while high school players were more volatile and too risky.
As you can probably tell, a lot of variance exists in the year-to-year percentage, but expanding the time frame to 2000-2014, the Brewers selected 60 percent of their players from college and only 40 percent from the prep ranks. While the Brewers largely haven’t succumbed to conventional wisdom when it comes to high school athletes, drafting 68.29 percent of players from college does seem high. Lindbergh’s article does illustrate that high school players are trending up and it is now much closer to a 50/50 split. If we look at the Brewers trends over the last five years, though, they have had one uptick in high school players taken, followed by one downtick. I am, of course, describing normal variance, but the amount of prep players picked tends to trend around the 30-to-40 percent mark, which is perhaps what we should expect going forward for the Brewers.
Before continuing, you might have noticed that the data goes back to 1968, which is odd, because the Brewers first came into existence in 1970. However, the Brewers were initially the Seattle Pilots. The Pilots only had one season of existence (1969), before they relocated to Milwaukee and became the Milwaukee Brewers. The 1968 draft constitutes the expansion draft, which happens every time the league adds a new team or teams. This is why the data extends back to 1968.
Now, we’ll take a look at the trends by position that the Brewers have been drafting. Let’s get an overall sense of their situation.
The infielders are separated by their respective positions, while the outfielders are simply labeled, “OF”. The data from Baseball-Reference had the outfield data labeled as OF, while for the infielders it showed their actual position. Defining what is a CF, LF, or RF can be difficult, especially for players who have yet to be drafted, as the data on them is so limited.
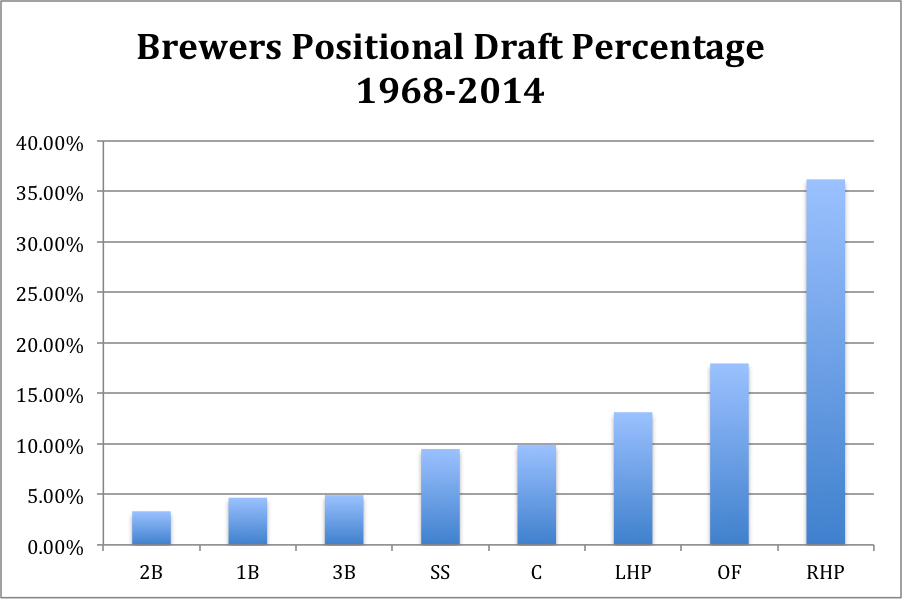
One can see that the vast majority of players drafted are right-handed pitchers. This makes sense. Half of baseball rosters are compromised of pitchers and most of them are righties. As a whole, though, it seems the Brewers tend to lean more towards pitchers than any other position. What did surprise me was the low amount of second basemen drafted; they even lean more towards first and third baseman, as opposed to second base.
This seemed strange, until I read “KATOH Goes to College: Projecting College Hitters” by Chris Mitchell. In this study, Mitchell showed that collegiate second baseman rarely provide any value. In fact, if one looks at the graph he created, the second base position basically drops off the map, even before the DH and 1B positions. This could be an indicator as to why the Brewers haven’t drafted a lot of second baseman. After all, it’s much easier to shift a shortstop or third baseman to second than it is to find a collegiate second baseman with elite skill.
Let’s now look at their positional draft trends through the years and see if there’s anything that stands out.
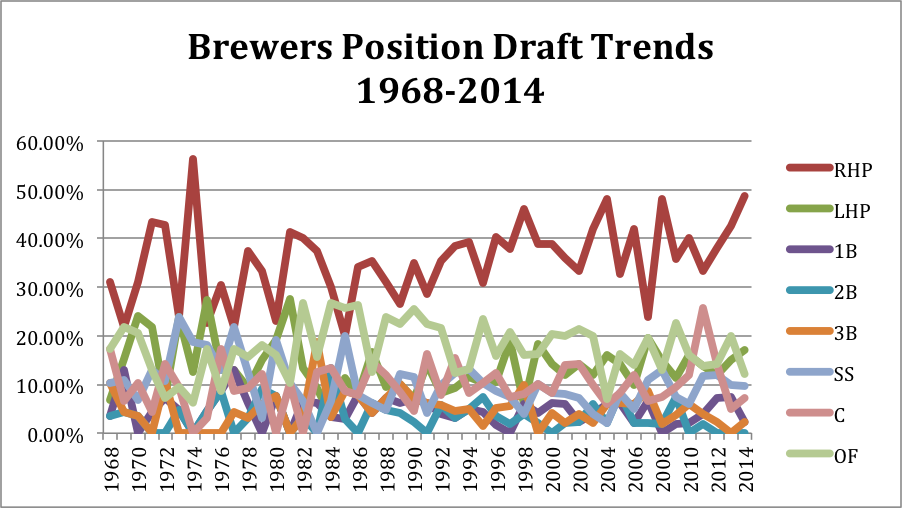
What a mess. I was actually debating (with myself) whether to even show this, but at least you can see for yourself that little can be gleaned from this graph. What if, though, I combined all the infield positions and combined the LHP and RHP into a single pitching category? Hopefully, this will provide a clearer picture in order to sift through all the noise.
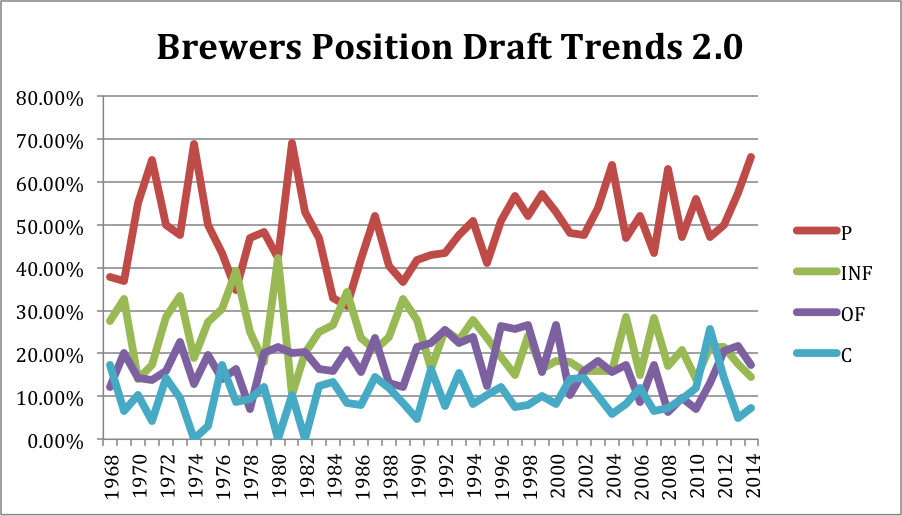
Ok, so this still isn’t pretty, but we do have a clearer picture to start making some observations. First, and this seems obvious, but pitchers rule the day. The Brewers are drafting more and more pitchers. What is also noticeable, though, is that the amount of infielders they are drafting is going down. The amount of infielders drafted was at an all-time high in 1977, when 39.11 percent of the players who were drafted were infielders, which was the only year where more infielders were drafted than pitchers. But since then, one can clearly see a downward trend in infielders being drafted. It’s unclear what is causing this trend, maybe it’s a change in organizational philosophy, but as an outside observer, I don’t have a great explanation for this internal trend. As for the catchers and outfielders, no distinctive trend seems to exist. For the most part, outfielders have hovered around the 20 percent mark and catchers have hovered around the 10 percent mark. Although, in 2011 there was a healthy upswing to 25.68 percent among catchers drafted by the Brewers.
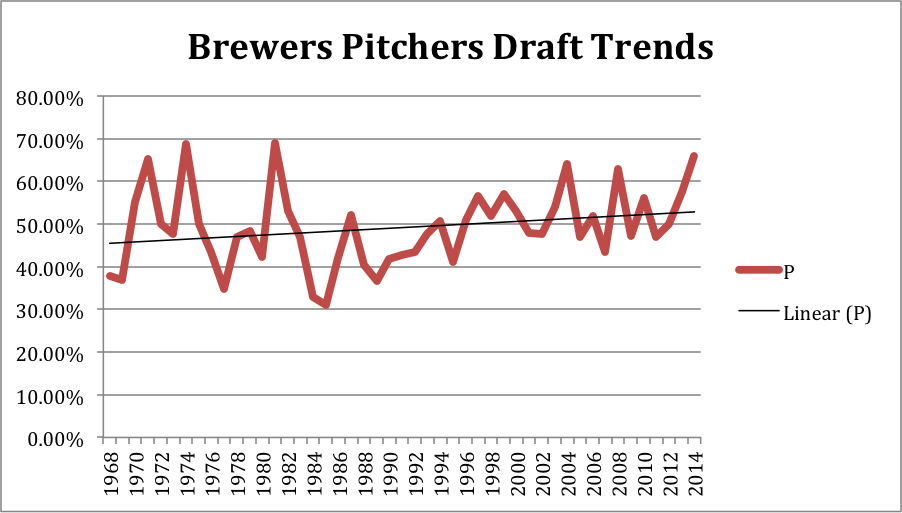
This a clearer look at the Brewers trend in drafting more pitchers:
Finally, here is a look at the percentage of players drafted by their position, by the Brewers in 2015.
| Position | Players | Percentage |
|---|---|---|
| RHP | 20 | 48.78% |
| LHP | 6 | 14.63% |
| 1B | 2 | 4.87% |
| 2B | 0 | 0.00% |
| 3B | 1 | 2.43% |
| SS | 5 | 12.19% |
| LF | 0 | 0.00% |
| CF | 1 | 2.43% |
| RF | 1 | 2.43% |
| OF | 1 | 2.43% |
| C | 4 | 9.75% |
While predicting the draft is an impossible process, analyzing trends can give a sense of what a team prioritizes and it could also help explain why certain players were drafted by specific teams. In reality, it gives us an overview of the situation. For example, next year, I would expect that around 60% of the players drafted by the Brewers would be pitchers. While there may be some variance, the trend in pitching is clearly going up and I would be shocked if it drastically started to drop. Trends also help us look at the Brewers inclinations in drafting certain positions. And the overall picture predominantly illustrates that the Brewers, more often than not, draft shortstops and catchers over any other infield position. This was also evident in this year’s draft, where they invested heavily into catchers and shortstops.
Overall, the draft can seem to be a mess. Lots of variance exists and trying to accurately predict it is a fool’s errand. However, these trends hopefully provide us with some kind of baseline to help set expectations for the Brewers’ future draft strategy.
3 comments on “The Milwaukee Brewers and Draft Trends”