A few weeks ago, on the BP Milwaukee podcast, host Vineet Barot wondered how many players the Brewers used in 2016 and how that compared to other teams. I thought it was an interesting question and therefore decided to find out. For today I’ll just put it into Brewers historical context, and when I have more time I’ll see how they compared to other teams.
Podcast:
Season Wrap
Basically, the Brewers used 50 total players in 2016. This includes any player who pitched even one inning or who had one at bat. But, what does this mean? Is this a normal trend of player usage? And does it have any relationship to winning?
To answer these questions, I scraped data from Baseball-Reference. I scraped all Brewers who played on a Brewers roster dating back to 1970.
Here are how many position players played for the Brewers per year.
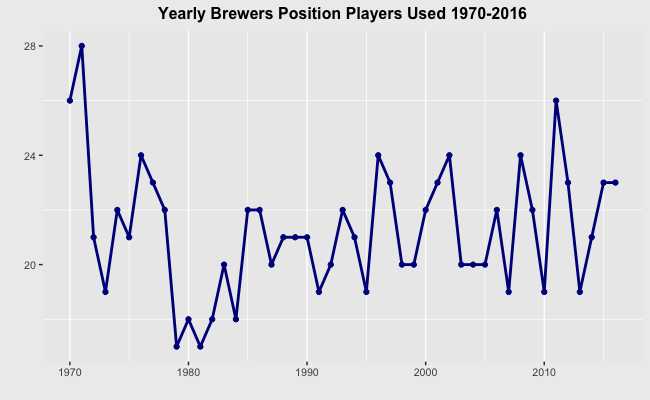
On average, 21 position players play on a Brewers roster every year since 1970. In 2016, the Brewers used 23 position players, slightly above average, but not all that much. There is a lot of variance from year to year, but for the position players, the usage remains between 20-24 players.
The 1970 and 1971 seasons were the years in which the Brewers used the most position players, but those were its first years as a franchise. It’s likely that in those years, the Brewers were trying unproven players. Making them more dispensable, and easier to change.
The pitcher’s usage, though, is a different story.
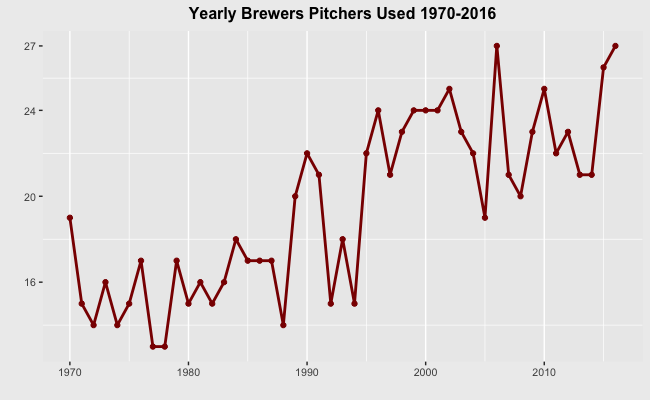
Throughout the years, the Brewers have been using more and more pitchers every year. 2016, actually had the highest usage of pitchers, tied with 2006 with 27 total pitchers used. This is eight more used than the average number of pitchers used per year of 19.
The rise in bullpen usage is no secret. Each year it seems that starters are pitching fewer, and fewer innings and relievers are encompassing more of the team’s innings pitched per year. And as Rob Arthur showed, we are currently seeing an extreme of that development in the playoffs. Especially with the usage of Andrew Miller. The question isn’t whether more relievers will be used in the future, but how much more.
Obviously, the more relievers used, the more pitchers one needs on a roster, as pitchers are more frequently injured and many relief pitchers can come up from AAA to make a spot appearance if the arms in the pen have been over utilized.
In the Brewers’ case, this season also saw the demotion of Wily Peralta, Taylor Jungmann, injuries to Michael Blazek, Corey Knebel, and more. The trades of Jeremy Jeffress and Will Smith opened the door for other, less experienced pitchers. Pitchers such as Junior Guerra, Jacob Barnes, Brent Suter, Damien Magnifico, etc., received their chances because of this combination of moves.
Plus, the fact that the Brewers are rebuilding probably made them more open to giving new and more pitchers a shot, seeing if they could catch lightning in a bottle.
As a whole, 2016 was the season, in which the Brewers used the most players in their franchise’s history.
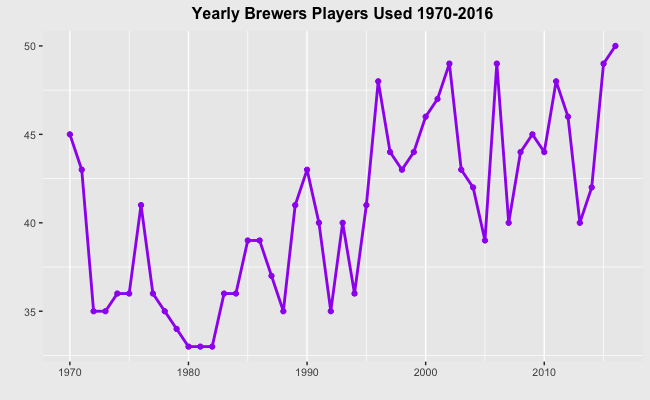
Previously, the most players used were in 2015, 2006, and 2002, when the Brewers used 49 players. On average 40 players are used each year.
The trend is obviously going up, but considering the previous two charts, it seems evident that this trend is primarily caused by the increased usage in pitchers.
I think an assumption which can easily be made from this is that the Brewers are using more players because of their record. Meaning, they used 50 players because of the fact that they had a down year, and the fact that they are rebuilding might make them more prone to using more players. They can also give more youngsters a chance, especially with September call-ups. As opposed to when they are good, because they can’t afford to give “lesser” players a chance, as it could cost them a crucial win.
Therefore, I looked at the relationship between wins and the count of players used each year, suspecting to see a slightly negative relationship. This would mean that there would be more players used on losing teams.
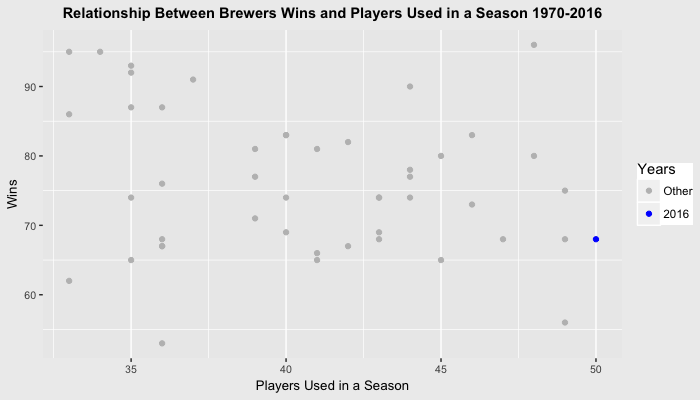
It’s somewhat hard to tell from the graph but there is a small negative relationship between wins and the count of players used each year. There is also a -0.21 correlation.
Basically, the record doesn’t have a huge impact on the amount of players used in a season. There are other factors to consider, but I would suspect that in the Brewers case the primary cause for the rise in total player usage is due to the rise in reliever usage as a whole.
As relievers become more specialized, there will naturally be more of them used. Many pitchers have the ability to throw one inning in the majors, and more jobs are opening up each year. There’s also a lot of variance in reliever success, meaning that it is likely that there will be more turnover from year to year, more so than in years past.
This article has been updated to correct a sentence about reliever usage.
Are September roster expansions a fairly recent development? If so, it would explain a little part of the increase in recent numbers versus the the earlier ones.
Great question! It’s tough to find definitive proof on this, but it appears that September roster expansion has happened since the 1950s: http://www.latimes.com/sports/la-sp-baseball-baxter-20150906-story.html
It is worth looking deeper into this, though, as very few publications appear to write about it.