For many years, pitchers were evaluated through Earned Run Average, better known as ERA. The statistic was invented by Henry Chadwick and started gaining popularity in the 1900s.
After many years in what Brian Kenny refer likes to refer to as “the dark ages” came the sabermetric movement, accompanied by a slew of new metrics. One of the more recent and popular discoveries is DIPS, by Voros McCracken, which brought us Fielding Independent Pitching (FIP), created by Tom Tango.
FIP was modeled after ERA. FIP looks at what a pitcher can control, walks, strikeouts, and home runs. With FIP, we can see which pitchers benefitted from the most luck, the previous season. The best way to do this is by looking at the difference between ERA and FIP. This also would give one insight into how likely a pitcher is to regress the following season.
As my colleague Ryan Romano points out, in a Beyond the Box Score article, FIP has its flaws, “Pitchers can control other elements of the game — some limit hard contact better than others, and some will melt down with runners on base. Because of pitch framing, fluky umpiring, park factors, and a host of other variables, they don’t necessarily control the three true outcomes, either.”
The good news is that 2015 brought two new pitching metrics. The first was contextualized FIP or cFIP, created by Jonathan Judge. Then came Deserved Run Average from Judge, Dan Turkenkopf, and Harry Pavlidis.
Basically, as Judge put it so eloquently, “The vast majority of a pitcher’s DRA is explained by his average linear weights allowed to opposing batters”. Now, DRA also takes into account what Judge calls “externalities”, which including catcher framing, temperature, team defense, the score, the stadium, and more.
cFIP is very similar to FIP. The biggest difference is that it takes into account the context. This includes the catcher, the umpire, the batter’s handedness, the stadium, and more. The most important thing to note, however, is that DRA is a descriptive metric while cFIP is a predictive metric, even though it has descriptive value. Therefore, we can now look at luck or overperformance in a new and better way.
Mainly, I wanted to look at which Brewers players had the biggest overperformance last season. In order to do this, I created a DNA chart to visually show the difference between DRA- and cFIP. (Minimum 50 innings pitched).
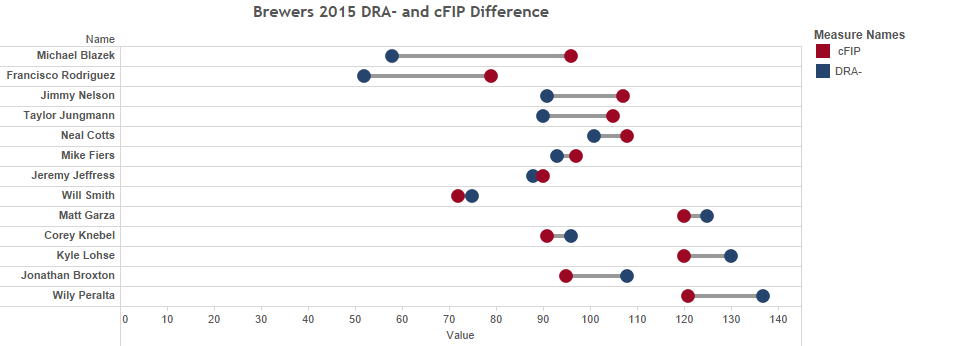
I’ve often raved about Michael Blazek’s 2015 season on this site, and for good reason. His 51 DRA- stands as one of the best in Brewers history and deserves praise.
With that said, there’s a reason that teams aren’t clamoring to trade for Blazek or that Blazek isn’t being considered for the Brewers closers job. Instead, all the rumors seem to be surrounding Jeremy Jeffress and Will Smith. Blazek, you see, way overperformed last season. His cFIP stands at 96 compared to his 51 DRA-, marking the biggest difference between DRA- and cFIP among all Brewers pitchers. Comparing it to the rest of the league, Blazek had the sixth biggest difference between his DRA- and cFIP.
In part, do to a fractured hand which ended his season early, Blazek only pitched 55.7 innings last year. This isn’t uncommon for relievers, but it does increase the chance of variation in performance due to the small sample size. It’ll be interesting to see how he performs next year, but this could be signaling that Blazek will have some regression in his performance. He’s never been a big strikeout guy, including last year, and has had trouble with his walk rate in the minors. If those were to flare up again, we could see a downturn in Blazek’s performance. Conversely, a 96 cFIP is still above average, so even though Blazek probably got lucky, he still was no slouch.
As mentioned above, Jeremy Jeffress and Will Smith, have both been mentioned in a few trade rumors this offseason. There’s also been some debate as to whom the “closers” job would go to. This might be because of a couple of factors. A) Both pitchers provided well above average production last season. B) There’s no reason to think those were flukes. Jeffress had the smallest difference between his DRA- and cFIP and Smith had the second smallest, among Brewers pitchers.
With their great stuff, both pitchers bring the ability to strikeout hitters at an above average clip. Jeffress is well known for his blistering fastball and Romano dubbed Smith’s slider as the Brewers best pitch in 2015, which help him accrue an insane 12.93 K/9 in 2015. If he can keep up that performance, then there’s a good chance Smith will repeat his performance from 2015.
I then did the same thing for the teams. (You’ll notice that the X-Axis starts at 80. I did this so that people could better see the difference between both metrics, but it should be noted that there’s far less variance here than there is among players, in general.)
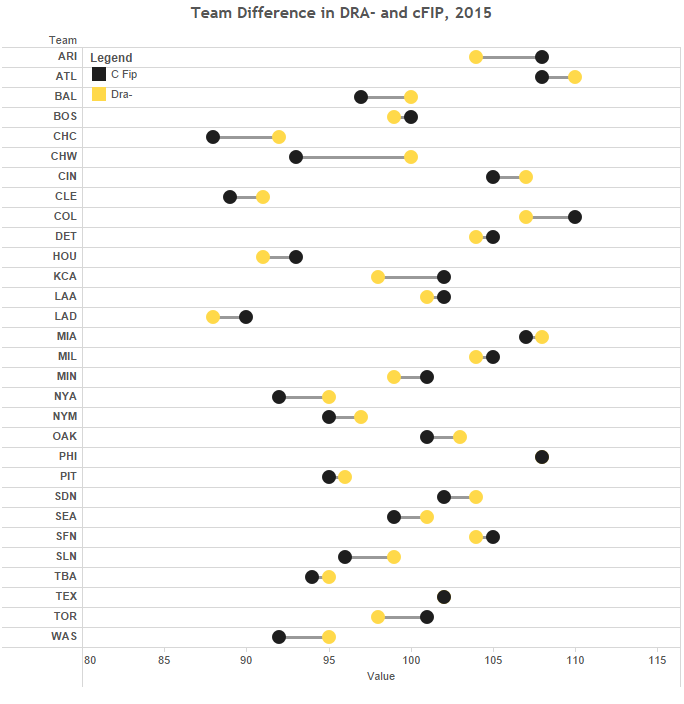
Unfortunately for the Brewers, there wasn’t a big difference between both metrics. The Brewers had a below average pitching staff last year, and they weren’t unlucky, as a whole. So, their performance wasn’t a product of bad luck but merely not having a great pitching staff.
One final element to note is that the White Sox were particularly unlucky last year. More so than any other team. Meaning that their pitching staff could be even better this upcoming season. This could further emphasize the point that they should go for it this upcoming season. Although, they still seem wishy-washy as to whether or not they truly want to compete.
This is an incredibly nerdy (and yet incredibly interesting) piece of writing. Well done!
Thanks, Benn! Glad you liked it.
Great article. Would love to see how Boyer fits in these charts…while he had a good era last year…he also led the league in inherited runs given up.
Thanks, Annie. Sorry for the late response. I basically made the same graph as before but added Blaine Boyer. Boyer had the 3 biggest difference between his DRA and cFIP, so he might be in for some regression next season.
(Just use this URL to see the graph).
https://public.tableau.com/profile/publish/BrewersDifferenceinDRA-cFIP2_0/Sheet1#!/publish-confirm