In 2015, it seemed as though the Brewers had no consistently competent starting pitchers. Matt Garza melted down, Kyle Lohse ran out of gas, Wily Peralta regressed hideously, and Mike Fiers left at the trade deadline. Taylor Jungmann performed pretty well, but he didn’t debut until June, and he wore down into the later part of the year. Only Jimmy Nelson reliably put up solid numbers every fifth day; for the campaign overall, he pitched to a 4.11 ERA and 106 cFIP over 177.1 innings, with 19.7 percent strikeouts and 8.6 percent walks.
A year later, the Brewers have a slightly more stable rotation. Junior Guerra has become something of an ace, and Zach Davies has certainly looked the part over his last several starts. Their presence has been especially important because of Nelson’s play: His strikeout rate has dipped to 18.5 percent, while his walk rate has inflated to 9.9 percent. Although he’s maintained a decent ERA at 3.92, he’s regressed under the surface — his cFIP has risen to 112, one of the highest in the majors among pitchers with as many innings.
Has Nelson actually gotten worse, though? By one metric, he’s simply suffered from a rash of bad luck. In 2015, 64.6 percent of Nelson’s pitches went for strikes*; that clip has fallen to 62.6 percent in 2016. But at the same time, he’s thrown 50.9 percent of his pitches in the strike zone this year, up from 48.2 percent last year, according to FanGraphs. Despite a drop in chases, from 30.7 to 26.8 percent, that means his expected strike rate has remained steady at 64.1 percent.
*Note: All strike rate data in this article, both actual and expected, does not include intentional balls.
This isn’t an especially common disparity. 115 pitchers have compiled at least 1,000 pitches in 2016; out of them, Nelson ranks ninth in strikes lost:
| Rank | Player | Innings | Str% | xStr% | Diff |
|---|---|---|---|---|---|
| 1 | Rich Hill | 64.0 | 63.4% | 66.8% | -3.4% |
| 2 | Carlos Rodon | 69.1 | 61.2% | 64.3% | -3.1% |
| 3 | Nate Karns | 71.0 | 61.7% | 64.1% | -2.4% |
| 4 | Vincent Velasquez | 61.2 | 64.6% | 66.6% | -2.0% |
| 5 | Hector Santiago | 73.0 | 63.5% | 65.4% | -1.9% |
| 6 | Carlos Martinez | 75.1 | 63.8% | 65.7% | -1.9% |
| 7 | Mike Pelfrey | 71.1 | 60.9% | 62.5% | -1.6% |
| 8 | Jordan Zimmermann | 78.0 | 67.0% | 68.6% | -1.6% |
| 9 | Jimmy Nelson | 85.0 | 62.6% | 64.1% | -1.5% |
| 10 | Bartolo Colon | 73.0 | 67.9% | 69.3% | -1.4% |
This anomaly is even weirder given the performance of the Brewers as a whole. I wrote in May that the club has netted considerably more strikes than its expected strike rate would suggest. Indeed, by this metric, Chase Anderson (62.0 percent actual, 59.4 percent expected), Davies (62.5 percent actual, 60.0 percent expected), and Peralta (59.2 percent actual, 57.1 percent expected) all rank in the top 10 in extra strikes. For whatever reason, Nelson has gone in the other direction.
It’s not as though Nelson has deserved to fall behind. To this point, he’s notched an above-average edge rate of 28.1 percent, up from 27.2 percent last year. Meanwhile, Jonathan Lucroy — who has caught nearly 90 percent of Nelson’s 2016 innings — has framed pretty well thus far, bouncing back from his poor showing last year. So it’s certainly possible, and perhaps probable, for Nelson’s strike rate to rise.
This season, across the major leagues, 63.8 percent of all pitches have gone for strikes. If Nelson can make it back to that level, he’ll most likely shrink his walk rate; plus, since strike throwing has a hand in strikeouts, this change could reverberate to Nelson’s strikeouts. Would this make him the solid mid-rotation arm he looked like in 2015?
While a higher strike rate obviously wouldn’t hurt Nelson’s cause, it won’t save him entirely. For one, his whiff rate has dropped pretty dramatically, from 10.0 to 7.4 percent. He’s also netted fewer ground balls, as well as more hard contact; consequently, his TAv against has bloated from .257 to .279. Getting into more pitchers’ counts may help to alleviate this, but it won’t solve Nelson’s problems entirely. For that to happen, he’ll need to address his changes in pitch mix:
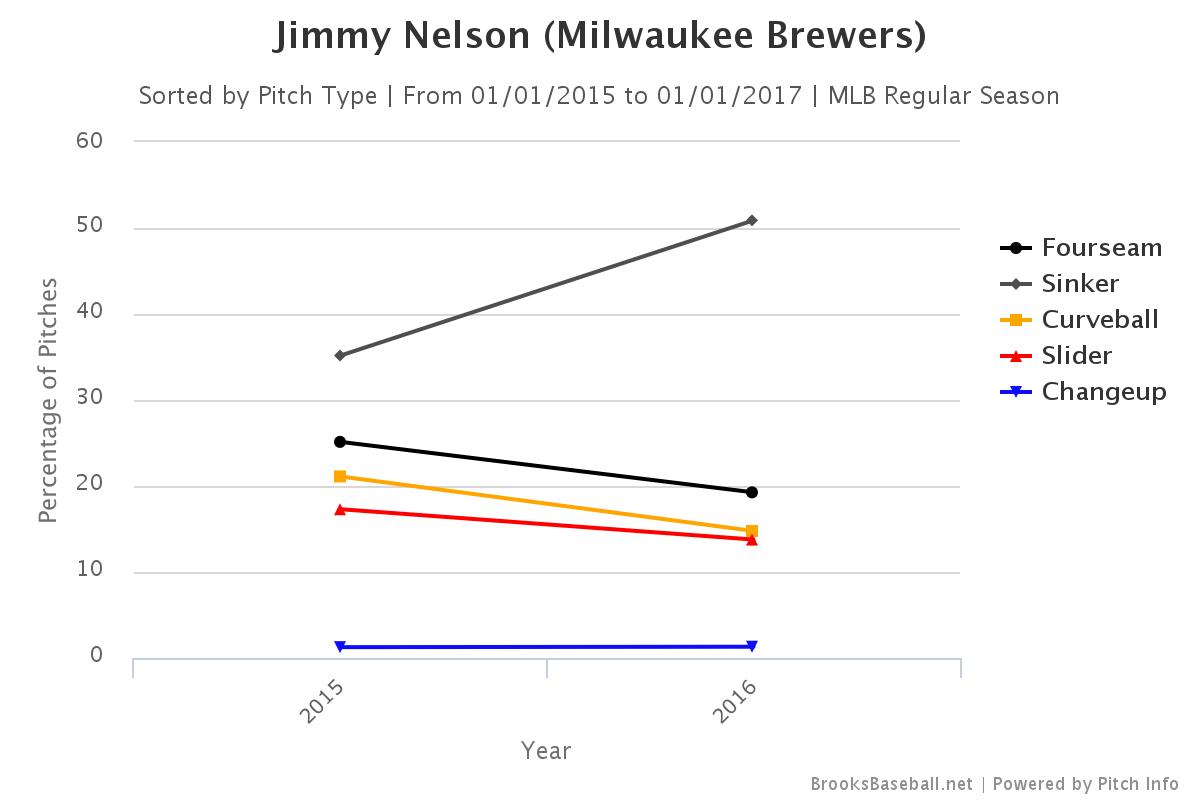
The sinker, Nelson’s primary offering, has always been the weak link of his repertoire. It has a lifetime whiff rate of 5.4 percent, whereas his four-seamer, curveball, and slider each sit above 10 percent. When put in play, the sinker has a TAv of .286, compared to .272 for the four-seamer, .250 for the slider, and .241 for the curveball. Nelson can’t use his sinker to deceive hitters or to induce weak contact, which explains why FG’s pitch weights grade it as 10.8 runs below average.
Yet Nelson has not only made the sinker his primary pitch, he’s prioritized it to an even greater extent. Last season, when he had his quasi-breakout, Nelson started to phase out the sinker; this season, he’s reversed that trend. His haplessness with the strike zone should go away into the summer, but the reduction in Ks and uptick in hard contact may stick around.
2016 has not gone well for many Brewers pitchers. Aside from the complete unraveling of Peralta, Jungmann has taken a step backward, as has Jorge Lopez. Together with Garza’s inability to stay healthy, this has put Milwaukee’s starting depth to the test. At first glance, Nelson’s devolution doesn’t mirror these; upon taking a deeper look, however, we see that he’s legitmitately declined. If Nelson doesn’t switch back to his recipe from 2015 — and if his ERA balloons to match his peripherals — the club may once again reach into that depth.
1 comment on “Jimmy Nelson Has Been Unlucky, and Bad”