Jeremy Hellickson might be the perfect pitcher to define the 2018 free agency class. There’s a lack of true impact arms outside of Yu Darvish and Jake Arrieta, both right-handed pitchers that are almost certain to receive massive contracts. Along with Arrieta and Darvish, the injured Michael Pineda also provides a potential upside play for an MLB team willing to weather the injury risk. And then….Hellickson stands as the fourth best pitcher, nearly tied with John Lackey. Unlike Lackey, however, Hellickson’s overall surplus increased due to a solid 2017 driven by peripheral performances that were betrayed by bad surface statistics. While Lackey is known as the much better career pitcher, a 46.3 WARP (!) arm entering his age-39 season, the age-31-to-be Hellickson boasts 11.3 career WARP with a much better 2017 campaign (4.62 Deserved Runs Average (DRA) between Philadelphia and Baltimore, good for 1.7 WARP). In fact, Hellickson had the better 2016, too, and that particular 189 inning, 3.91 DRA season is undoubtedly the reason his surplus ranks so high among free agency arms.
Here are the Top 10 2017 free agent arms, with the full table available here:
| Player | 17Depreciation | 18Depreciation | Change |
|---|---|---|---|
| Jake Arrieta | 86.632 | 75.411 | -11.221 |
| Michael Pineda | 44.198 | 39.347 | -4.851 |
| Yu Darvish | 32.683 | 38.122 | 5.439 |
| Jeremy Hellickson | 22.834 | 28.91 | 6.076 |
| John Lackey | 35.084 | 28.861 | -6.223 |
| Francisco Liriano | 44.345 | 26.95 | -17.395 |
| Jaime Garcia | 23.079 | 24.794 | 1.715 |
| Tyson Ross | 43.071 | 23.667 | -19.404 |
| Wade Davis | 27.146 | 22.638 | -4.508 |
| R.A. Dickey | 27.685 | 22.246 | -5.439 |
Related Reading: “Forecasting Chase” || “Free Agency”
Thankfully for the Brewers, no one is talking about Hellickson. Baseball Prospectus recently began a free agency ranking series, and Hellickson failed to make the Top 50. This is perfectly acceptable for Milwaukee’s purposes, however, for Hellickson is the perfect definition of a free agency class that is loaded with pitchers that have surface imperfections but are perfectly suitable to design deep and serviceable rotations. Hellickson is a more interesting case in terms of convincing Brewers fans of his merits, given his 8-11, 5.43 ERA surface performance in 2017, as well as his declining strike out rate (from 19.6 percent in 2016 to 13.8 percent in 2017). Yet, the 6’1″, 190 pound righty armed with a cutter, curve, and change up behind his primary fastball could be the perfect opportunity to apply the lessons from Jimmy Nelson and Chase Anderson’s mechanical successes.
| Free Agent | Depreciated Surplus (3yrs) | Draft Compensation? | Best Contract |
|---|---|---|---|
| Jeremy Hellickson | $28.9M | No ($5.7M draft value) | 2 years / $35.0M |
Over the last four seasons, Hellickson has morphed his pitching arsenal to amplify his change up and move away from his primary, rising-riding fastball. In fact, it is surprising to see the righty work as a true “junkball” arm in 2017, turning to that change up so frequently as to select it more than any of his other pitches. The intrigue about this arsenal development will be in the balance between 2015, 2016, and 2017. Between 2015 and 2016, Hellickson made his first shift to the cutter while also doubling down on his change up, which drove his most successful season since 2011 (and arguably his most successful season of his career in terms of strike out rate and groundball rate alongside DRA). One could question whether these developments went a step too far in 2017, as the veteran leaned on his change up more than ever while also turning to a riding-sinking fastball and increasing that cutter.The following table tracks the basic development of Hellickson’s arsenal and pitch selection over the last four seasons (“FB” means “fastball” here):
| Hellickson (Velocity) | Primary FB | Secondary FB | Change | Curve | Cutter | Slider |
|---|---|---|---|---|---|---|
| 2014 | 42.2% (91.1) | 10.6% (90.8) | 28.2% (80.9) | 18.8% (76.7) | 0.2% (90.4) | n.a. |
| 2015 | 51.8% (91.1) | 5.1% (90.6) | 22.2% (81.1) | 20.4% (77.9) | 0.5% (88.0) | n.a. |
| 2016 | 33.6% (90.8) | 15.7% (90.5) | 26.0% (81.0) | 15.3% (77.3) | 9.1% (86.2) | 0.3% (82.4) |
| 2017 | 19.1% (90.5) | 26.2% (90.5) | 30.2% (81.7) | 12.4% (77.1) | 12.1% (87.3) | n.a. |
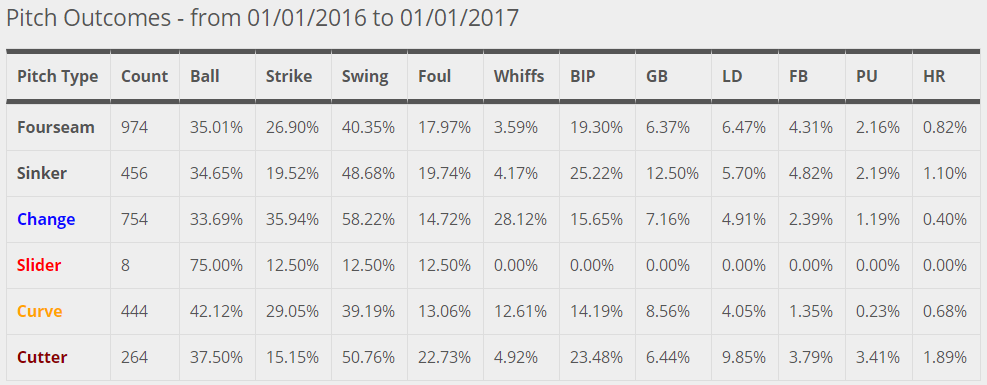
Following these arsenal shifts and pitch selection patterns, Hellickson’s strike out rate suffered in 2017. The decline in strike outs seemingly follows a very clear pattern with the evolution in this pitching approach. Compare 2016 Brooks Baseball outcomes….
…with 2017 outcomes:
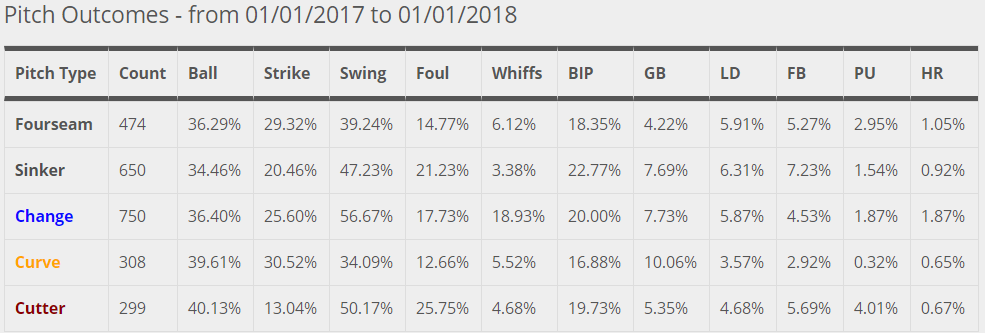
For developing an account of the vanishing strike outs, following the change up and curveball results between these charts. Those 2016 whiff rates on the change up and curveball are not necessarily outliers, which is the first important information to supplement these outcome charts. In 2015, Hellickson drew 23 percent whiffs with his change up and 16 percent with the curve; in 2014, those numbers were 22 percent with the change and 12 percent with the curve. The major factors here are (1) the complete turn from a primary, rising fastball approach to a sinking fastball approach, (2) the extreme reliance on the change up over time, and (3) the introduction and increased reliance on the cut fastball.
The cutter is a peculiar pitch for Hellickson, as the righty landed it in the strike zone less frequently in 2017, but still elicited swings on the pitch approximately half the time. This pitch was seemingly meant to induce weak contact, as the whiffs remained low both seasons (below 5 percent), while the foul ball percentages were very high both seasons. In 2017, those increased foul balls, as well as pop ups, drained the line drive rate from the pitch. This arguably ate into Hellickson’s strike out results, but the outcomes with the cutter were not problematic. Here, the change and curve come to mind as the primary sources of trouble: while Hellickson continued to combine both pitches for approximately 42 percent of his total arsenal, he continued to diminish use of the curve in favor of the change. However, this arrangement was accompanied by fewer strikes, a notable decline in swings, and subsequently plummeting whiff rates. When batters did swing, they hit the ball far, doubling the number of fly balls off of the change up; what was a fantastic pitch in 2016 (.173 AVG, 41 percent strike out rate, and .274 BABIP), the change up morphed into a nightmare in 2017 (.250 AVG, .509 SLG, 28 percent strike out rate, and .283 BABIP). Coupled with increased usage of the sinking fastball, which was not a strong suit for Hellickson to begin with, the shift to increased cutter usage, decreased curve, and extreme change up selection resulted in mound performance that drifted away from the quiet success of 2016.
Looking back at Chase Anderson’s profile, one can see how 2017 exhibited success through balance, alongside mechanical adjustments related to the secondary offerings for the righty. Comparing Anderson to Hellickson on a one-to-one basis is difficult in part because of Anderson’s climbing fastball velocity, but the adjustments involving the secondary pitches, and the balancing of those offerings between the change, curve, and even cutter became a source of success for the veteran. For example, Anderson’s whiff rate on the curve and cutter skyrocketed as both pitches increased in usages and Anderson pounded the zone more frequently than in 2016.
| Anderson (Velocity) | Primary FB | Secondary FB | Change | Curve | Cutter | Slider |
|---|---|---|---|---|---|---|
| 2014 | 40.1 (91.9) | 21.2 (91.4) | 19.8 (81.9) | 18.9 (77.8) | n.a. | n.a. |
| 2015 | 38.4 (92.6) | 23.0 (92.2) | 23.9 (82.4) | 14.1 (77.6) | 0.5 (89.1) | n.a. |
| 2016 | 35.9 (92.2) | 20.8 (91.8) | 24.0 (82.6) | 13.5 (77.5) | 5.7 (89.0) | 0.0 (87.4) |
| 2017 | 33.5 (93.8) | 19.4 (93.1) | 16.1 (84.1) | 18.3 (78.6) | 12.8 (89.9) | n.a. |
It’s difficult to not see the similarities between Hellickson and Anderson, as well. Both pitchers had difficult years in terms of run prevention, the latter in 2017 and the former in 2016, when their change up use climbed, their curve decline, and the balance was not yet right between the three fastballs. Without the velocity increase of Anderson, one might not expect Hellickson to improve as drastically within the Brewers system, yet it’s worth remembering that the veteran Hellickson was a 3.0+ WARP starting pitcher before Anderson was; this is not a knock on Anderson, but a recognition that he has some template for success that he can return to, or some feel for adjusting at the MLB level. In fact, given the rotational success of Zach Davies, as well as pitching staff success involving Brent Suter, it is arguable that Milwaukee is a fantastic pitching location for the exact arsenal imbalance exhibited by Hellickson in 2017. There has been a 3.4 K/BB, 43 percent groundball pitcher in Hellickson, just as there was a 3.3 K/BB, 41 percent groundball pitcher embedded in Anderson’s arsenal and world of mechanical potentialities; a particular challenge for Brewers analytics is to design a system based around specific profiles of success and spin those lessons into valuable roster acquisitions and development.
The test here is how the Brewers front office can forecast from their scouting, mechanical, and coaching successes with their 2017 staff: Hellickson is another righty with an extremely similar frame, upright delivery, and five-pitch arsenal centered around three fastballs, change up, and curve. Between age-29 and age-31, this profile is not particularly common in the MLB. An outwardly “analytical” front office should be able to process the information collected from their previous successes, from PITCHf/x data to professional insights from coaches, and balance those lessons for each particular profile that resides on their pitching staff.
From a statistical standpoint, this case is beyond a “small sample size,” for it is as arguably as biased as nearly any mechanical problem could be. Working with pitching mechanics presents an inherently biased standpoint to the pitcher, coaching staff, and front office alike. Yet, while statistical methods indeed draw fruitful observations through many applications, more narrow, biased problems reveal the depths of thought that can be applied to pitching (or mechanical problems in general); pitching in this regard is more of an ecosystem, a system of dynamic interactions, a case where even through unrepeatable singularities one may find signals worth amplifying.
Where a previous imbalance existed in Chase Anderson’s approach, a current imbalance exists in Jeremy Hellickon’s arsenal, and the Brewers are precisely the club that can capitalize on the latter’s free agency status, redevelop that arsenal within their system, and deploy a deep rotation to maintain the pitching successes of 2017. This is the type of move that can define the club moving forward, and the type of move that can answer now-popular questions like, “Who is the next Charlie Morton?,” now applied to Milwaukee’s particular coaching standpoint.
Photo Credit: Derik Hamilton, USAToday Sports Images