It’s one of those beautiful gifts bestowed by the length of the baseball season, an absolute honor handed down from the mundane days of July, a happy accident from depth-oriented roster construction. Most of the baseball season is biding time, and while that can result in blissful anomalies such as Eric Kratz and Hernan Perez pitching in the same ballgame (covering three innings!), it can also result in accidental ace match-ups, thrilling pitching match-ups that one could not have possibly imagined in April.
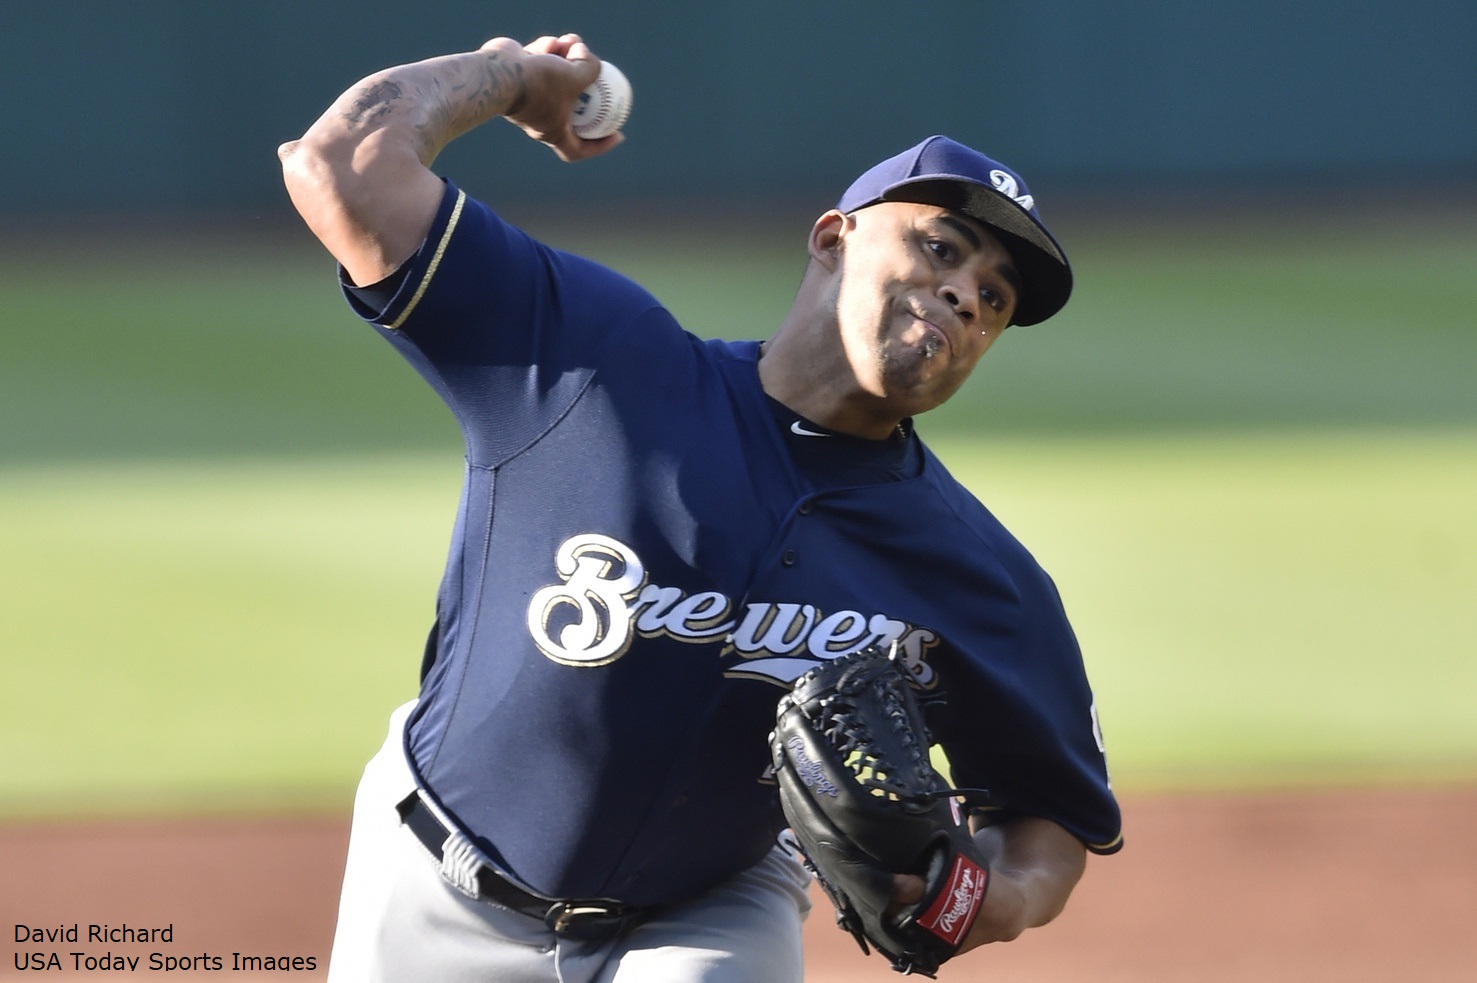
So it goes tonight at Miller Park, where Ace Junior Guerra hosts Ace Jeremy Hellickson, in a battle perhaps of who can throw the most off-speed pitches, or who can inexplicably baffle batters the longest. It is a battle of unexpected success from low-cost MLB acquisitions, a battle of success from seemingly pedestrian scouting profiles, a battle of baseball lifers who just don’t quit, even after facing adversity in 2017.
Runs Prevented Workbook, July 22:
https://docs.google.com/spreadsheets/d/1tmMK4LKWkYmDrkjnwHvJDvuur7evmWAUrwynvyRapYo/edit?usp=sharing
Primer: Exploring Runs Prevented
The Brewers Have a Good Rotation
While it’s not a monthly turn of the calendar, it is the beginning of the unofficial second half of the season, so I assembled another Runs Prevented workbook to assess the progression of MLB pitching performances. The instructions are in the workbook, but basically I used Baseball Prospectus team average and individual pitcher Park Factors, as well as Baseball Reference Three Year and Single Year Park Factors, and basic MLB Runs Allowed per Game, to construct an average of Runs Prevented across the league. Runs Prevented is an important statistic not because it is predictive or attempts to say anything about underlying performance (for that I use Deserved Run Average [DRA] to construct a Runs Prevented “counterfactual”), but because Runs Prevented can simply be plugged into the context of each team in order to assess the actual distribution of runs allowed on the field. Basically, this is everything messy and contextual about the game that ends up on the scoreboard: who receives the best fielding support? Who receives the best bullpen support? Questions like these impact Runs Prevented, but since the game is typically won according to outscoring opponents, I like Runs Prevented as an actual estimation of a pitcher’s real time performance quality.
Since most teams are approximately 100 games through the season, I added a new feature to this workbook: Rotational Averages. Thus far, MLB teams have employed 242 “regular” starters and 36 emergency (“One Game”) starters, which basically averages to more than nine starting pitchers per MLB team. If you were questioning the Brewers rotation during the off season, and continue to question their quality throughout the season, preparing for this war of attrition is indeed the strength of the club; MLB teams have around sixty games remaining and have already required throngs of starting pitching. GM David Stearns’s brilliance for the offseason came in constructing a seemingly mundane rotation that fit the quietly exceptional fielding unit, and could be seamlessly shuffled between roles (or MLB and Triple-A Colorado Springs) to provide starts whenever necessary.
So what does an MLB rotation look like? That depends on what you value. Below, I’ve constructed two tables: the first table assesses MLB rotational roles by Games Started (under the theory that a Number One starter pitches the most rotational turns, and each spot slots in behind that pitcher); the second table assesses MLB rotational roles by Runs Prevented (under the theory that a Number One starter is actually the best starter on the club, and each spot slots in behind that pitcher).
| Rotation by GS | Pitchers | IP | RnsPrv |
|---|---|---|---|
| 1 | 30 | 121.55 | 7.88 |
| 2 | 30 | 112.54 | 3.45 |
| 3 | 30 | 102.65 | -3.30 |
| 4 | 30 | 78.73 | -0.61 |
| 5 | 30 | 60.31 | -3.47 |
| 6 | 30 | 42.19 | -3.84 |
| 7 | 30 | 34.17 | -1.79 |
| 8 | 31 | 20.24 | -2.89 |
| E | 36 | 13.30 | -2.37 |
What is interesting about this table is that Runs Prevented are rather evenly distributed, between good and bad pitchers, according to Games Started category. Here a Number One starter is Justin Verlander (30 Runs Prevented) and Clayton Richard (-9 Runs Prevented), and so on. The value here is filling rotational turns, and recognizing that MLB teams need those rotational turns filled.
By Runs Prevented, on the other hand, a so-called Ace is closer to what I believe fans mean when they talk about Aces. But the bottom really falls out on the rotation:
| Rotation by RnsPrv | Pitchers | IP | RnsPrv |
|---|---|---|---|
| 1 | 30 | 116.38 | 18.59 |
| 2 | 30 | 71.65 | 6.60 |
| 3 | 30 | 56.84 | 2.94 |
| 4 | 30 | 51.59 | 0.04 |
| 5 | 30 | 55.18 | -2.23 |
| 6 | 30 | 41.54 | -3.53 |
| 7 | 30 | 47.60 | -5.05 |
| 8 | 30 | 75.36 | -7.47 |
| 9 | 30 | 56.09 | -12.23 |
| 10 | 7 | 71.91 | -22.16 |
Here, Justin Verlander is clearly a Number One starter, and Clayton Richard is something like a Number Eight or Number Nine starter, even though both pitchers have taken the most turns for their respective clubs.
Each of these rotational assessments demonstrates the shortcomings of analyzing an MLB rotation. Fans and analysts alike prefer to conceive of a rotation as “Five Turns,” following the traditional “five-man rotation” that operates in the MLB, but the trouble is that that classification only suggests a “rest” cycle. One could also use pure scouting grades to categorize each pitcher’s arsenal, command, mechanics, etc., and that might get us closer to a No. 1 / No. 2 / No. 3 / No. 4 categorization; here the trouble is that No. 1 pitchers really don’t exist, then, and most MLB teams are defined by how well they scout and prepare a group of No. 3 / No. 4 starters to “play up.”
This should help to frame the dissonance, and brilliance, that is the Brewers rotation:
| Brewers Rotation | Prv_Avg | Class | GS | Class |
|---|---|---|---|---|
| Junior Guerra | 10.95 | 1 | 18 | Pure 3 |
| Freddy Peralta | 7.07 | 2 | 7 | Pure 6 |
| Wade Miley | 4.33 | 3 | 4 | Pure 7 |
| Jhoulys Chacin | 4.16 | 3 | 21 | Pure 1 |
| Chase Anderson | 4.14 | 3 | 20 | 1-to-2 |
| Brandon Woodruff | -3.29 | 6 | 4 | Pure 7 |
| Zach Davies | -5.42 | 7 | 8 | Pure 6 |
| Aaron Wilkerson | -5.67 | 7 | 1 | Emergency |
| Brent Suter | -6.32 | 8 | 18 | Pure 3 |
By scouting profile, there is nothing close to a No. 1, or even a No. 2, in the Brewers rotation. Currently, Junior Guerra might reach the best grades based on his splitter, which could legitimately be the best pitch in the rotation; based on 2017, one would clearly expect Chase Anderson to serve as the top rotation hurler in terms of pure stuff, but that has not materialized in 2018 (showing the true difficulty of consistent mechanical adjustments by MLB pitchers). In scouting terms, Jhoulys Chacin, Brandon Woodruff, and Zach Davies would probably fight for the purest “No. 3 starter in a good way” classification, although Davies’s injury and Woodruff’s usage pattern would certainly impact that. Otherwise, it’s not even clear what type of MLB roles these guys should be given: Freddy Peralta is a bizarre type of “all-floor” pitcher (meaning, take him as he is, from deception to fastball movement to command profile), and Brent Suter could probably be scouted the same way.
By Runs Prevented profile, however, the Brewers have done what could have been expected of them during the preseason analysis cycle. Many people misunderstood the value of how the Brewers were constructing a rotation, but basically the runs saved by keeping a truly bottom-of-the-league, replacement-style Runs Prevented pitcher out of the rotation would boost the lack of an ace; coupled with the fact that the Brewers were reasonably expected to have several middle of the rotation types, truly serviceable arms, that advantage of not “bottoming out” could be exponentially exploited with each turn in the rotation. For designing a team to withstand a baseball season, even a playoff series, is all about how one distributes risk profiles (and therefore, Runs Prevented): by flattening the risk of a truly awful start almost every single time through the rotation, the Brewers “play up” from their expected scouting roles, DRA underlying profiles (thanks to the defense), and therefore distribute quality Runs Prevented for the team. This is a systemic pitching staff.
Is Junior Guerra an Ace?
I’ve written extensively about the lack of aces in the past (here too), in order to emphasize that a pitching rotation need not be conceptualized by top-tier talent. Furthermore, given the variance at play in MLB pitching from season to season, the simple fact is that very few pitchers, so few pitchers so as to be impossible to categorize, work the consistent, year-in, year-out Runs Prevented profiles that match what fans and analysts (seemingly) mean when they talk about “Aces.”
Now, however, it is worth asking whether Junior Guerra may become a true “Ace” if his 2018 campaign continues. For Guerra prevented approximately 22 runs during his unprecedented 2016 breakout season, and now the righty is holding steady at approximately 10 runs prevented throughout the 2018 campaign. This is really, really good: if the top 10 percent of MLB starting pitchers is demarcated by approximately 16 runs prevented, Guerra is threatening to reach that threshold in two of his last three seasons. This is an excellent occurrence for the Brewers, who stuck with Guerra through a difficult 2017 campaign, and (presumably) allowed the righty to once again work throughout the winter in order to iron out his mechanics. Thus Guerra is clearly establishing himself as some type of globetrotting rotation leader, a workhorse who does not stop pitching year-round and flashes his splitter across the Americas.
If Guerra keeps this up, he’ll simply be #BrewersAce, Ace Guerra, not #2016BrewersAce or #2018BrewersAce. Which should be a great lesson for Brewers fans: aces need not hail from praiseworthy draft profiles or big International bonuses, or nine figure free agency contracts; sometimes they’re just waiting there, on the waiver wire, in need of a mechanical adjustment or a simple chance to pitch.
Correct for the Wrong Reasons
In the offseason, I wrote about Jeremy Hellickson as a potential free agency target for the Milwaukee Brewers rotation. The veteran righty was coming off of a poor surface statistics season that nevertheless featured fantastic underlying performance metrics and very clear areas for improvement in pitch selection. Summarizing Hellickson’s potential surplus value and areas of improvement, I compared the veteran righty’s arsenal and approach to Chase Anderson, using Anderson’s development from 2016 to 2017 as a potential model for Hellickson. I am writing about this now, though, because my words on Hellickson have the privilege of appearing correct, but for the wrong reason; I suggested that the concern with Hellickson was between the balance in his fastball and change up usage, as his cutter was looking for a comfortable place within his arsenal. The implication was that if Hellickson could find a balance somewhat akin to Anderson’s 2017 development, the veteran’s quality change up could return.
By contrast, Hellickson went entirely in the opposite direction, by decreasing his primary fastball, secondary fastball, and cutter usage in order to select his change up and curve more frequently than any other pitch (!!!).
| Hellickson (Velocity) | Primary FB | Secondary FB | Change | Curve | Cutter | Slider |
|---|---|---|---|---|---|---|
| 2016 | 33.6% (90.8) | 15.7% (90.5) | 26.0% (81.0) | 15.3% (77.3) | 9.1% (86.2) | 0.3% (82.4) |
| 2017 | 19.1% (90.5) | 26.2% (90.5) | 30.2% (81.7) | 12.4% (77.1) | 12.1% (87.3) | n.a. |
| 2018 | 16.1% (90.3) | 22.1% (90.1) | 24.6% (81.5) | 25.7% (77.3) | 11.5% (87.5) | n.a. |
According to Bill James, a junkball pitcher is one who throws a change up “first,” i.e., more than any other pitch, and I like that definition because it attributes junkball status more to pitch selection than velocity (hence my favorite sometimes-junkball pitcher, the fire throwing Edinson Volquez). But if a pitcher throws a change up more than any other pitch, what of a pitcher who throws a change and curve more than any other pitcher? I enter 2018 Jeremy Hellickson as the vaunted “Double Junkball” pitcher, a pitcher who gives you the blues thrice over because he throws a change up more frequently than any other pitch, a curveball more frequently than any pitch but the change, and he was available for nothing more than a minor league contract despite exhibiting underlying traits worthy of nearly $30 million in depreciated surplus value.
But Brewers fans can’t be picky, as this is the organization that made Junior Guerra work (twice!), signed Jhoulys Chacin as their rotational front piece over the offseason, is currently making Wade Miley work, and skipped Fastballer Freddy Peralta over the much-more hyped (and much clearer scouting role) Corbin Burnes to round out the back end of the rotation. Wanting to add Hellickson to that mix is just greedy, but oh what a rotation it could have been, what one with some of the slowest fastballs and most unsuspecting command profiles in the MLB combining to prevent runs like their lives depended on it.
Here, I’m revisiting my past work on Hellickson in order to understand why I was wrong, and to demonstrate the fickle nature of scouting profiles. A perceived fix to a glitch in a pitcher’s arsenal can run in many directions, and it is worth using probabilistic thinking to clearly demarcate and analyze each of those potential directions. Probabilistic thinking means designing a thinking process that thinks through the potential outcomes in a given scenario, including reasons for those potential outcomes and (ideally) assigning weights or probabilities to those potential outcomes. This is the type of thinking that can be applied to difficult-to-quantify areas such as pitching profiles, where data are assembled but can move in multiple directions due to strategy. In the offseason, I thought Hellickson needed to balance his fastballs and take back his change up a notch in order to reassert its success; it turns out that that could mean diminishing fastball use all together, and playing up the curveball to reassert a successful profile.